

Question: Python In this exercise we will compare numpy's computing time to make an array (list) to Python's computing time using list comprehension whilst plotting some
Python
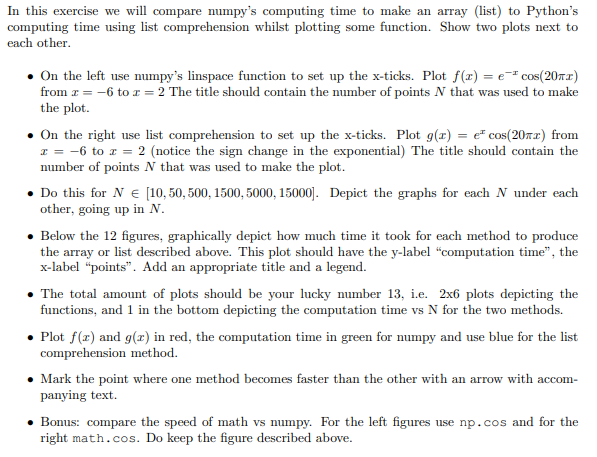
In this exercise we will compare numpy's computing time to make an array (list) to Python's computing time using list comprehension whilst plotting some function. Show two plots next to each other. . On the left use numpy's linspace function to set up the x-ticks. Plot f(2)= e-*cos(2012) from z= -6 tor=2 The title should contain the number of points N that was used to make the plot. . On the right use list comprehension to set up the x-ticks. Plot g(x) = e cos(20 ) from = -6 to 2 = 2 (notice the sign change in the exponential) The title should contain the number of points N that was used to make the plot. Do this for NE (10,50,500, 1500, 5000, 15000). Depict the graphs for each N under each other, going up in N. . Below the 12 figures, graphically depict how much time it took for each method to produce the array or list described above. This plot should have the y-label "computation time, the x-label "points". Add an appropriate title and a legend. The total amount of plots should be your lucky number 13, i.e. 2x6 plots depicting the functions, and 1 in the bottom depicting the computation time vs N for the two methods. . Plot f(c) and g() in red, the computation time in green for numpy and use blue for the list comprehension method. Mark the point where one method becomes faster than the other with an arrow with accom- panying text. Bonus: compare the speed of math vs numpy. For the left figures use np.cos and for the right math.cos. Do keep the figure described above. In this exercise we will compare numpy's computing time to make an array (list) to Python's computing time using list comprehension whilst plotting some function. Show two plots next to each other. . On the left use numpy's linspace function to set up the x-ticks. Plot f(2)= e-*cos(2012) from z= -6 tor=2 The title should contain the number of points N that was used to make the plot. . On the right use list comprehension to set up the x-ticks. Plot g(x) = e cos(20 ) from = -6 to 2 = 2 (notice the sign change in the exponential) The title should contain the number of points N that was used to make the plot. Do this for NE (10,50,500, 1500, 5000, 15000). Depict the graphs for each N under each other, going up in N. . Below the 12 figures, graphically depict how much time it took for each method to produce the array or list described above. This plot should have the y-label "computation time, the x-label "points". Add an appropriate title and a legend. The total amount of plots should be your lucky number 13, i.e. 2x6 plots depicting the functions, and 1 in the bottom depicting the computation time vs N for the two methods. . Plot f(c) and g() in red, the computation time in green for numpy and use blue for the list comprehension method. Mark the point where one method becomes faster than the other with an arrow with accom- panying text. Bonus: compare the speed of math vs numpy. For the left figures use np.cos and for the right math.cos. Do keep the figure described above
Step by Step Solution
There are 3 Steps involved in it

Get step-by-step solutions from verified subject matter experts