

Question: python ( introduction class) plotting i want to know how to read the file You are given a file named cinema_stats.csv which contains information about
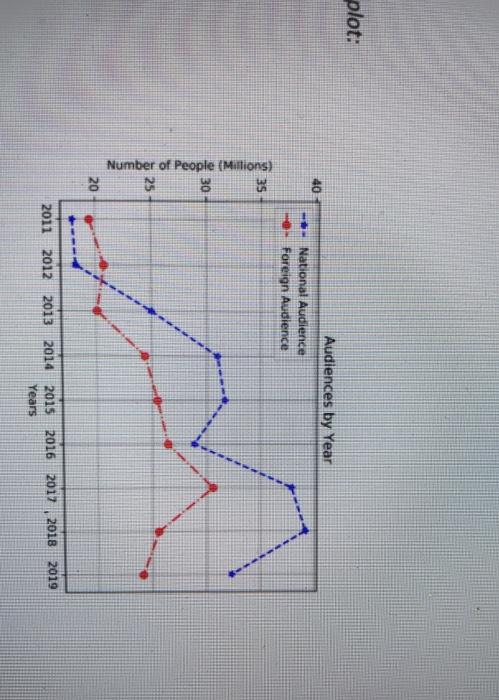
You are given a file named cinema_stats.csv which contains information about movie theaters and audience in Turkey. It has the following columns: Year (integer), NumCinema: Number of cinemas (integer), Capacity: Total seat capacity (integer), NationalFilms: Number of national movies shown (integer), ForeignFilms: Number of foreign movies shown (integer), National Audience: People who watched national movies in millions (float), ForeignAudience: People who watched foreign movies in millions (float). I read file function: Read all the information in the csv file into a dictionary of dictionaries For this part, you have to fill the read_file() function. This function takes the filename as input and returns the data in the dictionary structure. You are NOT allowed to use modules other than the ones that are already imported in the starter file. If you cannot solve this part, then refer to next page (). plot audiences function: Plot National Audience and Foreign Audience vs. Year in the same line graph. Your plot should look like the figure on the next page. You do NOT have to change xtick and ytick. However, make sure you all text you see in the sample. For this part, you have to fill the plot_audiences() function. This function takes the data as input and draws the plot. It saves the plot on a file named audience.png. Make sure your program can work with different data files that have the same format (do not assume that years go from 2011 to 2019, for example). main function: in the main function, call the read_file function to read the data from file. Then call the plot_audiences function to create your plot. plot: 40 Audiences by Year National Audience Foreign Audience 30 Number of People (Millions) 25 20 2011 2012 2013 2014 2016 2017 2018 2019 2015 Years You are given a file named cinema_stats.csv which contains information about movie theaters and audience in Turkey. It has the following columns: Year (integer), NumCinema: Number of cinemas (integer), Capacity: Total seat capacity (integer), NationalFilms: Number of national movies shown (integer), ForeignFilms: Number of foreign movies shown (integer), National Audience: People who watched national movies in millions (float), ForeignAudience: People who watched foreign movies in millions (float). I read file function: Read all the information in the csv file into a dictionary of dictionaries For this part, you have to fill the read_file() function. This function takes the filename as input and returns the data in the dictionary structure. You are NOT allowed to use modules other than the ones that are already imported in the starter file. If you cannot solve this part, then refer to next page (). plot audiences function: Plot National Audience and Foreign Audience vs. Year in the same line graph. Your plot should look like the figure on the next page. You do NOT have to change xtick and ytick. However, make sure you all text you see in the sample. For this part, you have to fill the plot_audiences() function. This function takes the data as input and draws the plot. It saves the plot on a file named audience.png. Make sure your program can work with different data files that have the same format (do not assume that years go from 2011 to 2019, for example). main function: in the main function, call the read_file function to read the data from file. Then call the plot_audiences function to create your plot. plot: 40 Audiences by Year National Audience Foreign Audience 30 Number of People (Millions) 25 20 2011 2012 2013 2014 2016 2017 2018 2019 2015 Years
Step by Step Solution
There are 3 Steps involved in it

Get step-by-step solutions from verified subject matter experts