

Question: Sample plot Audiences by Year - National Audience - Foreign Audience You are given a file named cinema_stats.csv which contains information about mov and audience
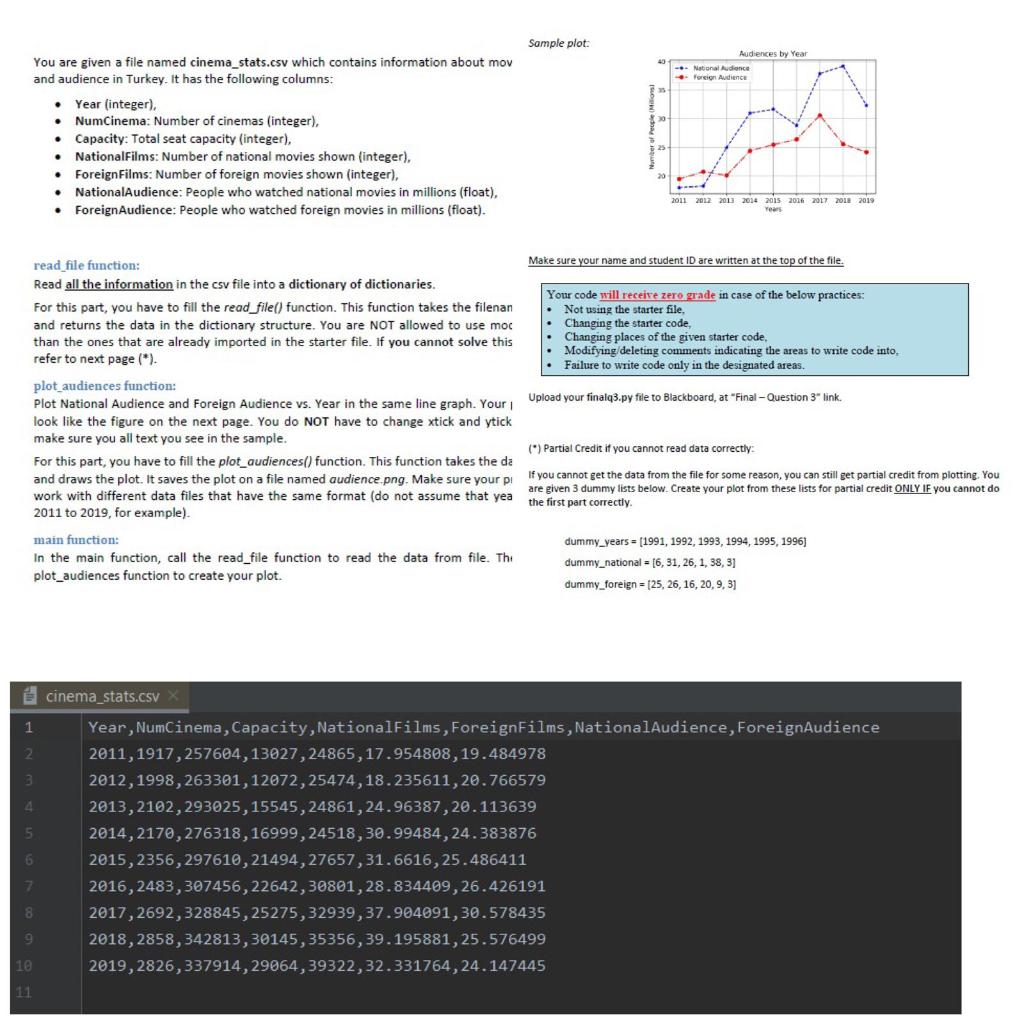
Sample plot Audiences by Year - National Audience - Foreign Audience You are given a file named cinema_stats.csv which contains information about mov and audience in Turkey. It has the following columns: Year (integer), NumCinema: Number of cinemas (integer), Capacity: Total seat capacity (integer), NationalFilms: Number of national movies shown integer), Foreign Films: Number of foreign movies shown (integer), NationalAudience: People who watched national movies in millions (float), Foreign Audience: People who watched foreign movies in millions (float). 2011 2012 2013 2014 2015 2016 2017 2018 2019 . Make sure your name and student ID are written at the top of the file. Your code will receive zero grade in case of the below practices: Not using the starter file, Changing the starter code, Changing places of the given starter code, Modifying deleting comments indicating the areas to write code into. Failure to write code only in the designated areas. read file function: Read all the information in the csv file into a dictionary of dictionaries. For this part, you have to fill the read_file() function. This function takes the filenan and returns the data in the dictionary structure. You are NOT allowed to use moc than the ones that are already imported in the starter file. If you cannot solve this refer to next page (*). plot audiences function: Plot National Audience and Foreign Audience vs. Year in the same line graph. Your look like the figure on the next page. You do NOT have to change xtick and ytick make sure you all text you see in the sample. For this part, you have to fill the plot_audiences() function. This function takes the da and draws the plot. It saves the plot on a file named audience.png. Make sure your pi work with different data files that have the same format (do not assume that yea 2011 to 2019, for example) Upload your finalq3.py file to Blackboard, at "Final - Question 3" link. (*) Partial Credit if you cannot read data correctly: If you cannot get the data from the file for some reason, you can still get partial credit from plotting. You are given 3 dummy lists below. Create your plot from these lists for partial credit ONLY IF you cannot do the first part correctly. main function: In the main function, call the read_file function to read the data from file. Thi plot_audiences function to create your plot. dummy_years = (1991, 1992, 1993, 1994, 1995, 1996) dummy_national = 16,31, 26, 1, 38, 31 dummy_foreign = 25, 26, 16, 20, 9, 31 cinema stats.csv 1 Year, NumCinema, Capacity, NationalFilms, ForeignFilms, NationalAudience, ForeignAudience 2011, 1917,257604,13027, 24865,17.954808, 19.484978 2012, 1998, 263301, 12072,25474,18.235611, 20.766579 2013, 2102,293025,15545,24861, 24.96387,20.113639 2014, 2170,276318, 16999,24518,30.99484,24.383876 2015, 2356,297610,21494,27657,31.6616,25.486411 2016, 2483,307456,22642,30801, 28.834409,26.426191 2017, 2692,328845,25275,32939,37.904091,30.578435 2018, 2858, 342813,30145, 35356, 39.195881,25.576499 10 2019,2826,337914,29064,39322,32.331764,24.147445
Step by Step Solution
There are 3 Steps involved in it

Get step-by-step solutions from verified subject matter experts