

Question: Python please!! density_air and density_water data posted below instructions! Lab8: Fit a polynomial to data and plot it density waterdat density air.dat Step 1: write
Python please!! density_air and density_water data posted below instructions!
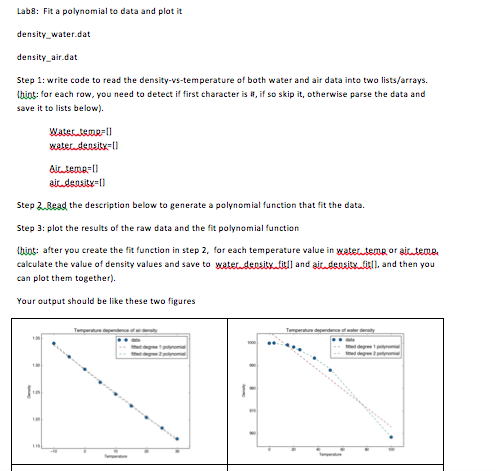
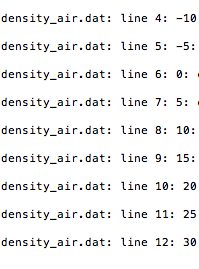
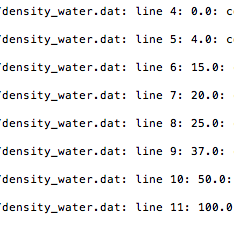
Lab8: Fit a polynomial to data and plot it density waterdat density air.dat Step 1: write code to read the density-vs-temperature of both water and air data into two lists/arrays. {hint: for each row, you need to detect if first character is #, if so skip it, otherwise parse the data and save it to lists below). water deositxll Step 2.Read the deseription below to generate a polynomial function that fit the data. Step 3: plot the results of the raw data and the fit polynomial function tbint: after you create the fit function in step 2, for each temperature value in waterteme or ai teme caleulate the value of density values and save to wate deositx titll and ai.asiill, and then you can plot them together) Your output should be like these two figures
Step by Step Solution
There are 3 Steps involved in it

Get step-by-step solutions from verified subject matter experts