

Question: PYTHON please Problem 1 Consider the graph given in Fig. 1: a. Construct the adjacency matrix (20points) b. Make a histogram for the degree distribution
PYTHON please
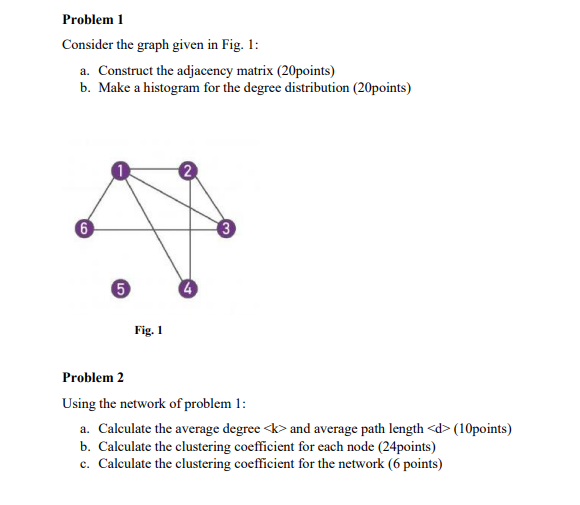
Problem 1 Consider the graph given in Fig. 1: a. Construct the adjacency matrix (20points) b. Make a histogram for the degree distribution (20points) 6 3 5 4 Fig. 1 Problem 2 Using the network of problem 1: a. Calculate the average degree and average path length
Step by Step Solution
There are 3 Steps involved in it

Get step-by-step solutions from verified subject matter experts