

Question: Python please, will thumbs up! Matplotlib Exercises 2. Create numpy arrays x list and ylist, such that their scatter plot contains 100 evenly spaced points
Python please, will thumbs up!
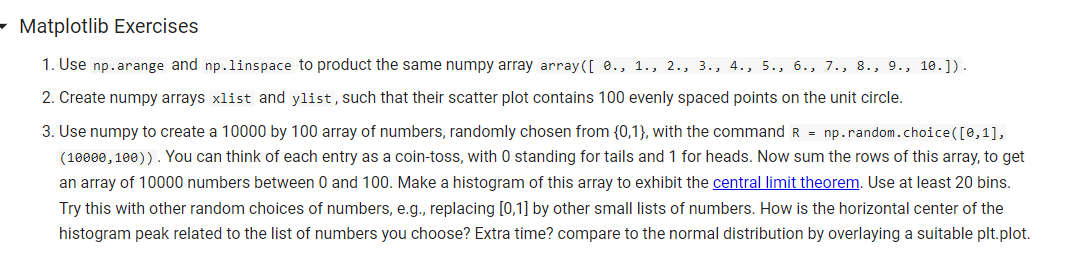
Matplotlib Exercises 2. Create numpy arrays x list and ylist, such that their scatter plot contains 100 evenly spaced points on the unit circle. 3. Use numpy to create a 10000 by 100 array of numbers, randomly chosen from {0,1}, with the command R=np. random.choice ([,1], (10000,100) ). You can think of each entry as a coin-toss, with 0 standing for tails and 1 for heads. Now sum the rows of this array, to get an array of 10000 numbers between 0 and 100 . Make a histogram of this array to exhibit the Use at least 20 bins. Try this with other random choices of numbers, e.g., replacing [0,1] by other small lists of numbers. How is the horizontal center of the histogram peak related to the list of numbers you choose? Extra time? compare to the normal distribution by overlaying a suitable plt.plot
Step by Step Solution
There are 3 Steps involved in it

Get step-by-step solutions from verified subject matter experts