

Question: Python preferred A. Write a script that implements the following methods. You can use built-in functions as needed. . Generates data from a multivariate Normal
Python preferred
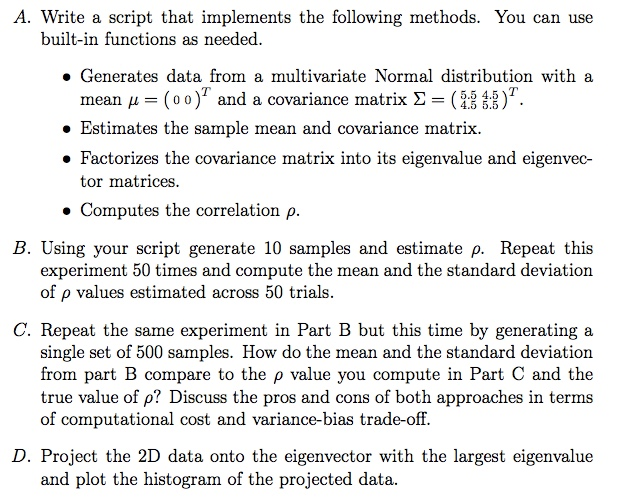
A. Write a script that implements the following methods. You can use built-in functions as needed. . Generates data from a multivariate Normal distribution with a mean u= (00)' and a covariance matrix S = (4:54:5)'. Estimates the sample mean and covariance matrix. Factorizes the covariance matrix into its eigenvalue and eigenvec- tor matrices. Computes the correlation p. B. Using your script generate 10 samples and estimate p. Repeat this experiment 50 times and compute the mean and the standard deviation of p values estimated across 50 trials. C. Repeat the same experiment in Part B but this time by generating a single set of 500 samples. How do the mean and the standard deviation from part B compare to the p value you compute in Part C and the true value of p? Discuss the pros and cons of both approaches in terms of computational cost and variance-bias trade-off. D. Project the 2D data onto the eigenvector with the largest eigenvalue and plot the histogram of the projected data. A. Write a script that implements the following methods. You can use built-in functions as needed. . Generates data from a multivariate Normal distribution with a mean u= (00)' and a covariance matrix S = (4:54:5)'. Estimates the sample mean and covariance matrix. Factorizes the covariance matrix into its eigenvalue and eigenvec- tor matrices. Computes the correlation p. B. Using your script generate 10 samples and estimate p. Repeat this experiment 50 times and compute the mean and the standard deviation of p values estimated across 50 trials. C. Repeat the same experiment in Part B but this time by generating a single set of 500 samples. How do the mean and the standard deviation from part B compare to the p value you compute in Part C and the true value of p? Discuss the pros and cons of both approaches in terms of computational cost and variance-bias trade-off. D. Project the 2D data onto the eigenvector with the largest eigenvalue and plot the histogram of the projected data
Step by Step Solution
There are 3 Steps involved in it

Get step-by-step solutions from verified subject matter experts