

Question: Python Problem: Variance Explanation: Problem 1: Computing variance For this problem, you will write a function variance that takes a list whose elements are numbers
Python Problem:
Variance Explanation:
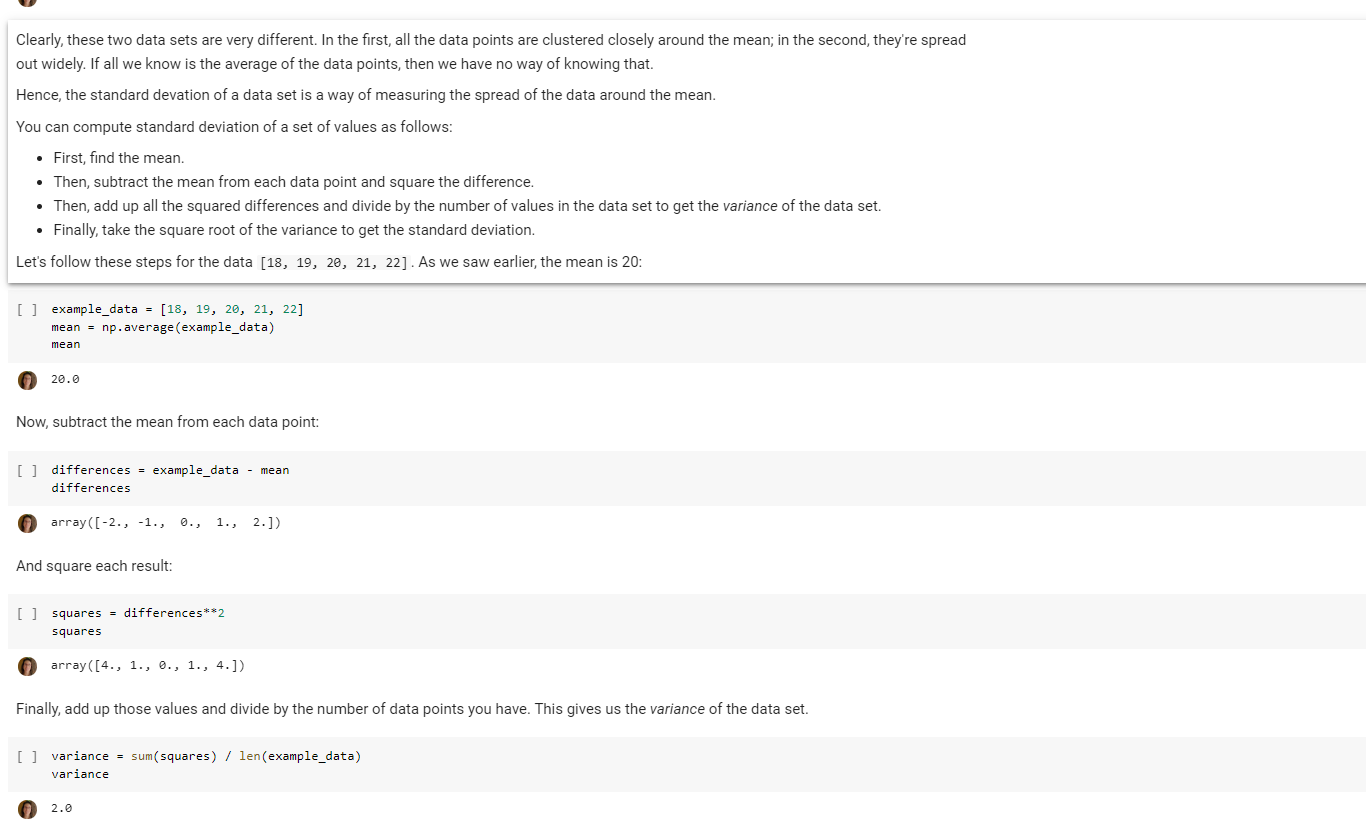
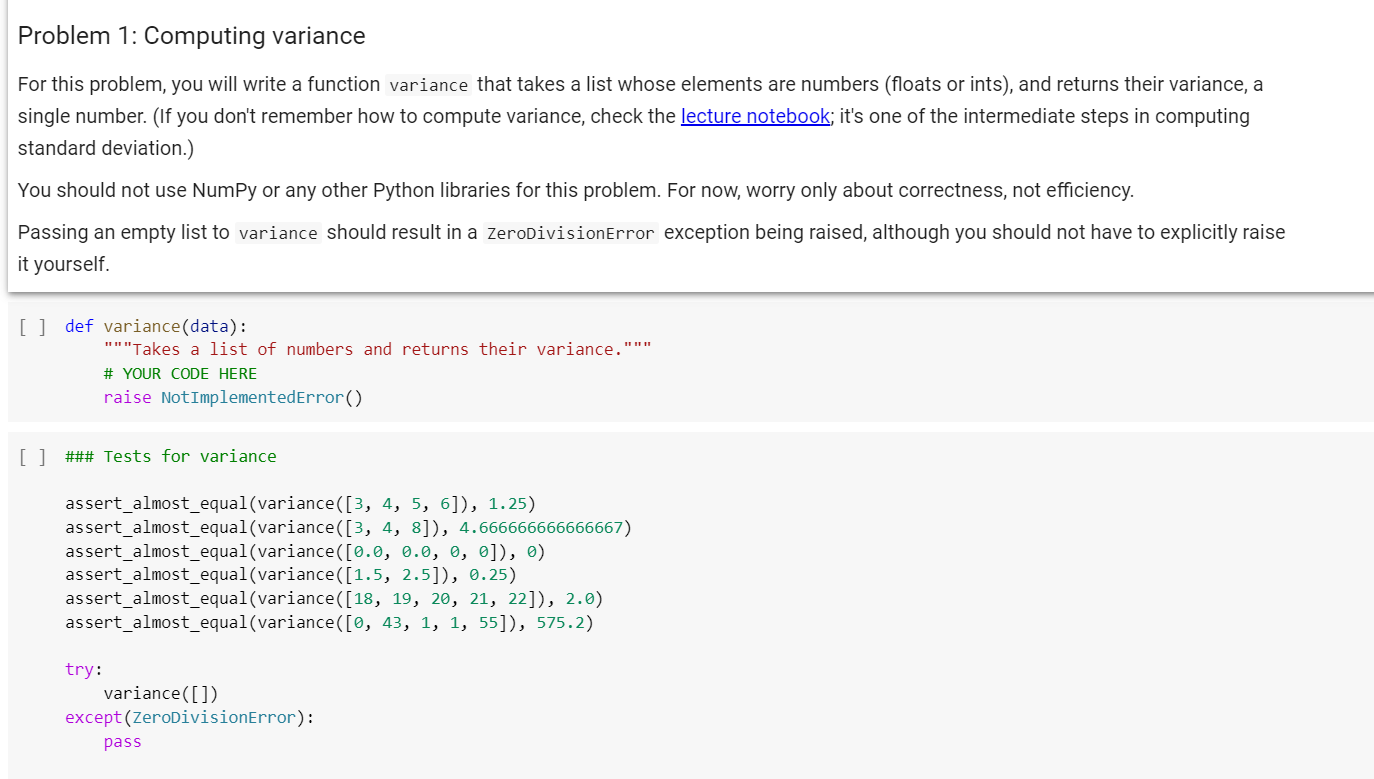
Problem 1: Computing variance For this problem, you will write a function variance that takes a list whose elements are numbers (floats or ints), and returns their variance, a single number. (If you don't remember how to compute variance, check the lecture notebook; it's one of the intermediate steps in computing standard deviation.) You should not use NumPy or any other Python libraries for this problem. For now, worry only about correctness, not efficiency. Passing an empty list to variance should result in a ZeroDivisionError exception being raised, although you should not have to explicitly raise it yourself. [] def variance (data): ""Takes a list of numbers and returns their variance.""". # YOUR CODE HERE raise NotImplementedError() [] ### Tests for variance assert_almost equal(variance([3, 4, 5, 6]), 1.25) assert_almost_equal(variance ([3, 4, 8]), 4.666666666666667) assert_almost_equal(variance ([0.0, 0.0, 0, 0]), 0) assert_almost_equal(variance([1.5, 2.5]), 0.25) assert_almost_equal(variance([18, 19, 20, 21, 22]), 2.0) assert_almost_equal(variance([0, 43, 1, 1, 55]), 575.2) try: variance([]) except(ZeroDivisionError): pass Clearly, these two data sets are very different. In the first, all the data points are clustered closely around the mean; in the second, they're spread out widely. If all we know is the average of the data points, then we have no way of knowing that. Hence, the standard devation of a data set is a way of measuring the spread of the data around the mean. You can compute standard deviation of a set of values as follows: First, find the mean. Then, subtract the mean from each data point and square the difference. Then, add up all the squared differences and divide by the number of values in the data set to get the variance of the data set. Finally, take the square root of the variance to get the standard deviation. Let's follow these steps for the data [18, 19, 20, 21, 22]. As we saw earlier, the mean is 20: [] example_data = [18, 19, 20, 21, 22] mean = np.average (example_data) mean 0 20.0 Now, subtract the mean from each data point: [] differences = example_data - mean differences 0 array([-2., -1., 0., 1., 2. ]) And square each result: [] squares = differences**2 squares array([4., 1., 9., 1., 4.]) Finally, add up those values and divide by the number of data points you have. This gives us the variance of the data set. [ ] variance = sum(squares) / len(example_data) variance 2.0
Step by Step Solution
There are 3 Steps involved in it

Get step-by-step solutions from verified subject matter experts