

Question: Python Programming Task description: PCA (Principle Component Analysis) is a dimensionality reduction technique that projects the data into a lower dimensional space. It can be
Python Programming
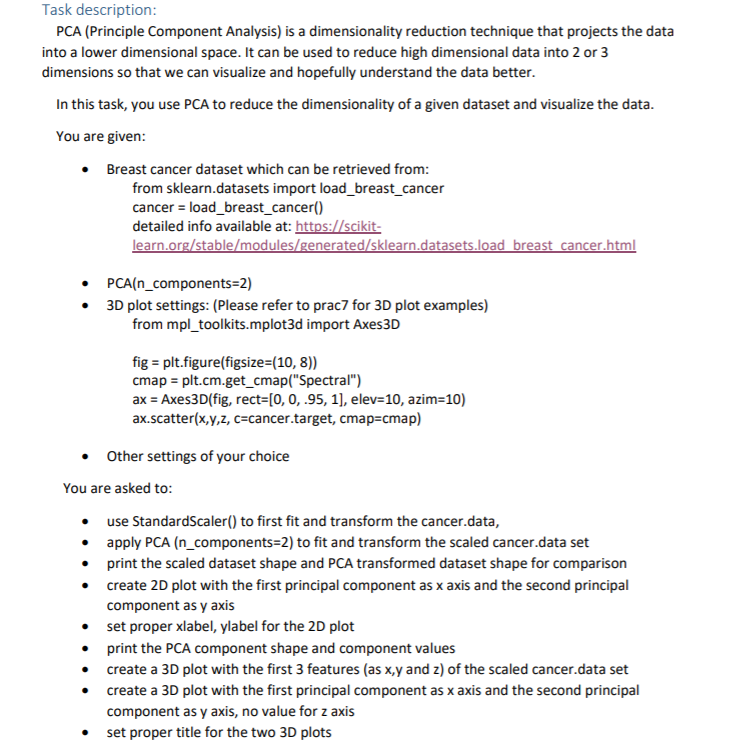
Task description: PCA (Principle Component Analysis) is a dimensionality reduction technique that projects the data into a lower dimensional space. It can be used to reduce high dimensional data into 2 or 3 dimensions so that we can visualize and hopefully understand the data better. In this task, you use PCA to reduce the dimensionality of a given dataset and visualize the data. You are given: . Breast cancer dataset which can be retrieved from: from sklearn.datasets import load_breast_cancer cancer = load_breast_cancer() detailed info available at: https://scikit- learn.org/stable/modules/generated/sklearn.datasets.load breast cancer.html PCA(n_components=2) 30 plot settings: (Please refer to prac7 for 3D plot examples) from mpl_toolkits.mplot3d import Axes3D fig = plt.figure(figsize=(10, 8)) cmap = plt.cm.get_cmap("Spectral") ax = Axes3D(fig, rect=[0, 0, .95, 1], elev=10, azim=10) ax.scatter(x,y,z, c=cancer.target, cmap=cmap) Other settings of your choice You are asked to: . use StandardScaler() to first fit and transform the cancer.data, apply PCA (n_components=2) to fit and transform the scaled cancer.data set . . print the scaled dataset shape and PCA transformed dataset shape for comparison create 2D plot with the first principal component as x axis and the second principal component as y axis set proper xlabel, ylabel for the 20 plot print the PCA component shape and component values create a 3D plot with the first 3 features (as x,y and z) of the scaled cancer.data set create a 3D plot with the first principal component as x axis and the second principal component as y axis, no value for z axis set proper title for the two 3D plots
Step by Step Solution
There are 3 Steps involved in it

Get step-by-step solutions from verified subject matter experts