

Question: Python programming Transcription factors (TFs) are proteins that bind DNA. They bind to promoter regions of genes on the DNA and activate (or sometimes suppress)
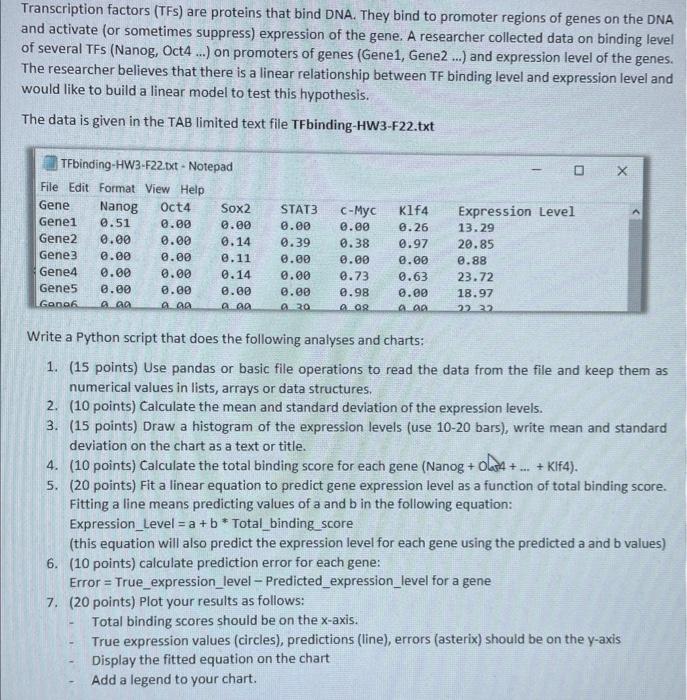
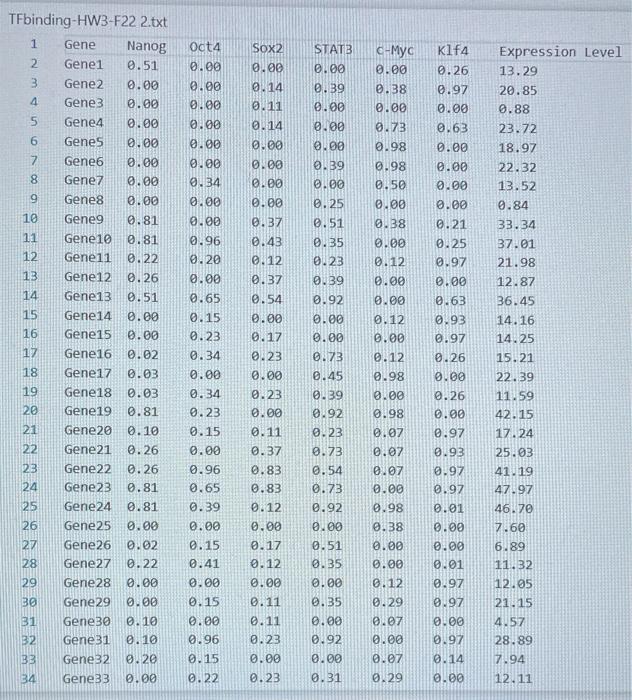
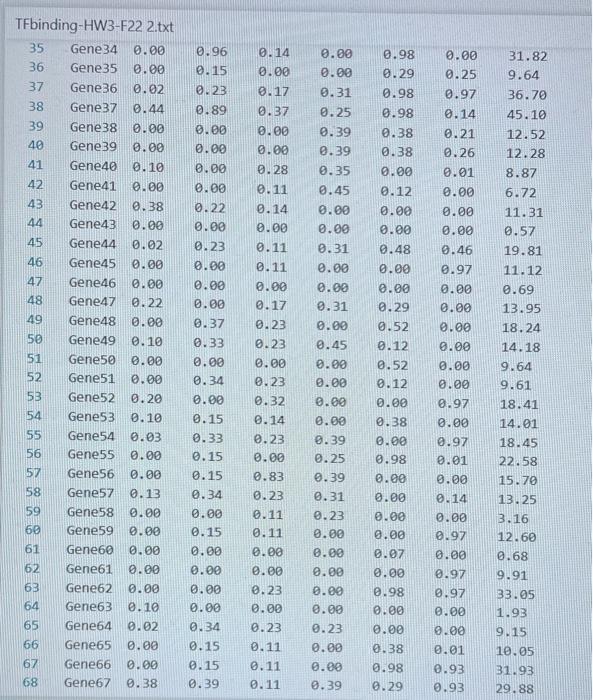
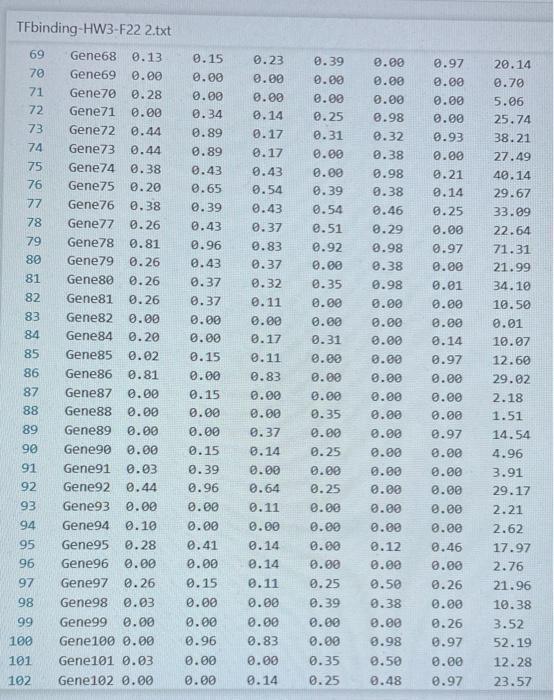
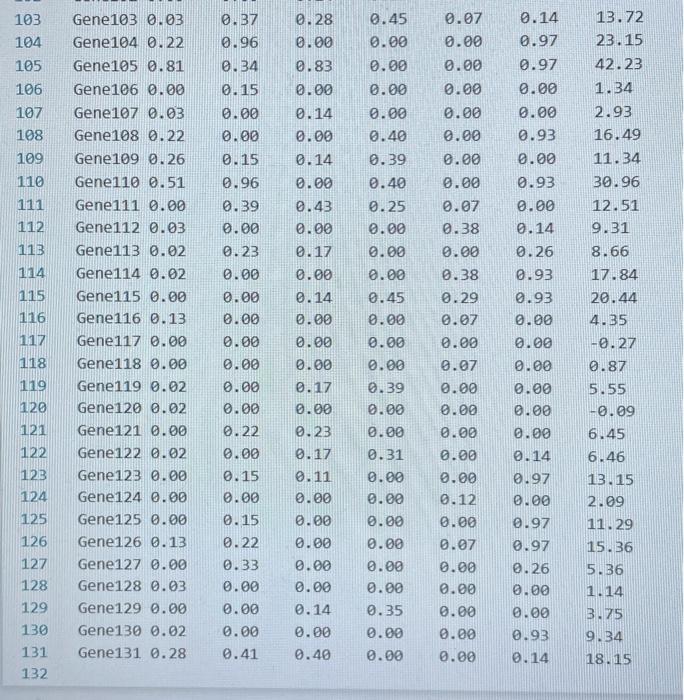
Transcription factors (TFs) are proteins that bind DNA. They bind to promoter regions of genes on the DNA and activate (or sometimes suppress) expression of the gene. A researcher collected data on binding level of several TFs (Nanog, Oct4 ...) on promoters of genes (Gene1, Gene2 ...) and expression level of the genes. The researcher believes that there is a linear relationship between TF binding level and expression level and would like to build a linear model to test this hypothesis. The data is given in the TAB limited text file TFbinding-HW3-F22.txt Write a Python script that does the following analyses and charts: 1. (15 points) Use pandas or basic file operations to read the data from the file and keep them as numerical values in lists, arrays or data structures. 2. (10 points) Calculate the mean and standard deviation of the expression levels. 3. (15 points) Draw a histogram of the expression levels (use 1020 bars), write mean and standard deviation on the chart as a text or title. 4. (10 points) Calculate the total binding score for each gene (Nanog +0 ba 4++ KIf4). 5. ( 20 points) Fit a linear equation to predict gene expression level as a function of total binding score. Fitting a line means predicting values of a and b in the following equation: Expression_Level =a+b * Total_binding_score (this equation will also predict the expression level for each gene using the predicted a and b values) 6. (10 points) calculate prediction error for each gene: Error = True_expression_level Predicted_expression_level for a gene 7. (20 points) Plot your results as follows: - Total binding scores should be on the x-axis. - True expression values (circles), predictions (line), errors (asterix) should be on the y-axis - Display the fitted equation on the chart - Add a legend to your chart. TFbinding-HWB-F22 2.txt TFbinding-HW3-F22 2.txt TFbinding-HW3-F22 2.txt
Step by Step Solution
There are 3 Steps involved in it

Get step-by-step solutions from verified subject matter experts