

Question: Python Pylab question First pic: Second pic: Third pic: You are asked to write Python functions to analyze the weather table from the previous question.
Python Pylab question
First pic:
Second pic:
Third pic:
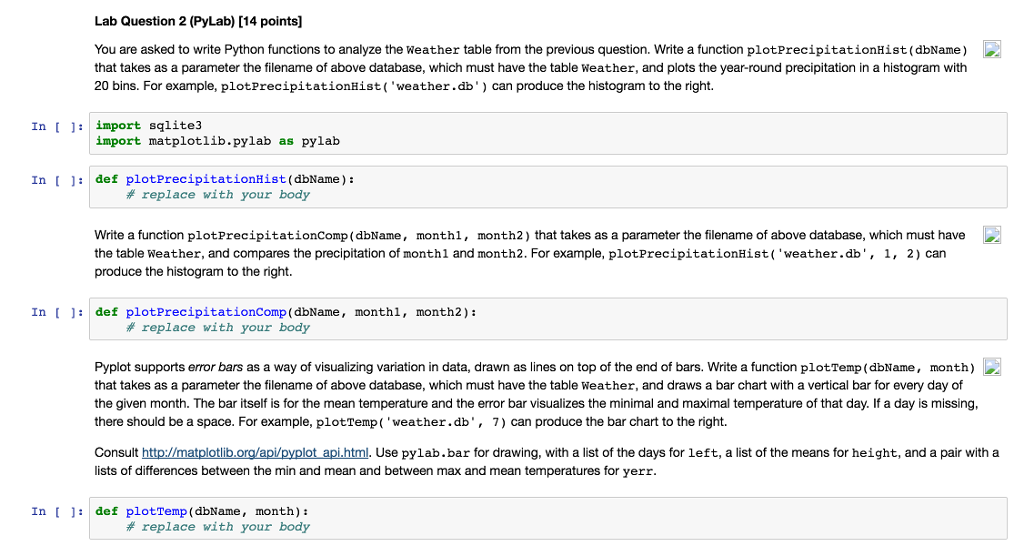
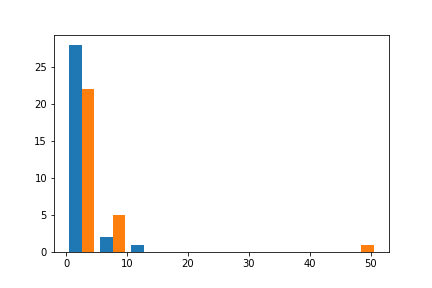
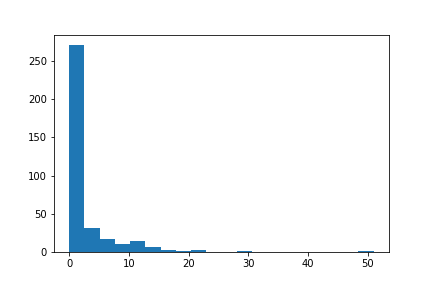
You are asked to write Python functions to analyze the weather table from the previous question. Write a function plotPrecipitationHist (dbName) that takes as a parameter the filename of above database, which must have the table Weather, and plots the year-round precipitation in a histogram with 20 bins. For example, plotPrecipitationHist ('weather middot db') can produce the histogram to the right. In []:import sqlite 3 import matplotlib middot pylab as pylab In []:def plotprecipitationHist(dbName): # replace with your body Write a function plotPrecipitationComp(dbName, month1, month2) that takes as a parameter the filename of above database, which must have the table weather, and compares the precipitation of month1 and month2. For example, plotPrecipitationHist (' weather middot db', 1, 2) can produce the histogram to the right. In []: def plotPrecipitationComp(dbName, month1, month2): # replace with your body Pyplot supports error bars as a way of visualizing variation in data, drawn as lines on top of the end of bars. Write a function plotTemp (dbName, month) that takes as a parameter the filename of above database, which must have the table weather, and draws a bar chart with a vertical bar for every day of the given month. The bar itself is for the mean temperature and the error bar visualizes the minimal and maximal temperature of that day. If a day is missing, there should be a space. For example, plotTemp (' weather middot db', 7) can produce the bar chart to the right. Consult http://matplotlib.org/api/pyplot api.html. Use pylab middot bar for drawing, with a list of the days for left, a list of the means for height, and a pair with a lists of differences between the min and mean and between max and mean temperatures for yerr. In []: def plotTemp(dbName, month): # replace with your body You are asked to write Python functions to analyze the weather table from the previous question. Write a function plotPrecipitationHist (dbName) that takes as a parameter the filename of above database, which must have the table Weather, and plots the year-round precipitation in a histogram with 20 bins. For example, plotPrecipitationHist ('weather middot db') can produce the histogram to the right. In []:import sqlite 3 import matplotlib middot pylab as pylab In []:def plotprecipitationHist(dbName): # replace with your body Write a function plotPrecipitationComp(dbName, month1, month2) that takes as a parameter the filename of above database, which must have the table weather, and compares the precipitation of month1 and month2. For example, plotPrecipitationHist (' weather middot db', 1, 2) can produce the histogram to the right. In []: def plotPrecipitationComp(dbName, month1, month2): # replace with your body Pyplot supports error bars as a way of visualizing variation in data, drawn as lines on top of the end of bars. Write a function plotTemp (dbName, month) that takes as a parameter the filename of above database, which must have the table weather, and draws a bar chart with a vertical bar for every day of the given month. The bar itself is for the mean temperature and the error bar visualizes the minimal and maximal temperature of that day. If a day is missing, there should be a space. For example, plotTemp (' weather middot db', 7) can produce the bar chart to the right. Consult http://matplotlib.org/api/pyplot api.html. Use pylab middot bar for drawing, with a list of the days for left, a list of the means for height, and a pair with a lists of differences between the min and mean and between max and mean temperatures for yerr. In []: def plotTemp(dbName, month): # replace with your body
Step by Step Solution
There are 3 Steps involved in it

Get step-by-step solutions from verified subject matter experts