

Question: Python Questions, Data is not fully completed, there are 50,000 rows. A B C Region 0 Sub-Saharan Africa 1 Europe 2 Europe 3 Europe 4
Python Questions, Data is not fully completed, there are 50,000 rows. 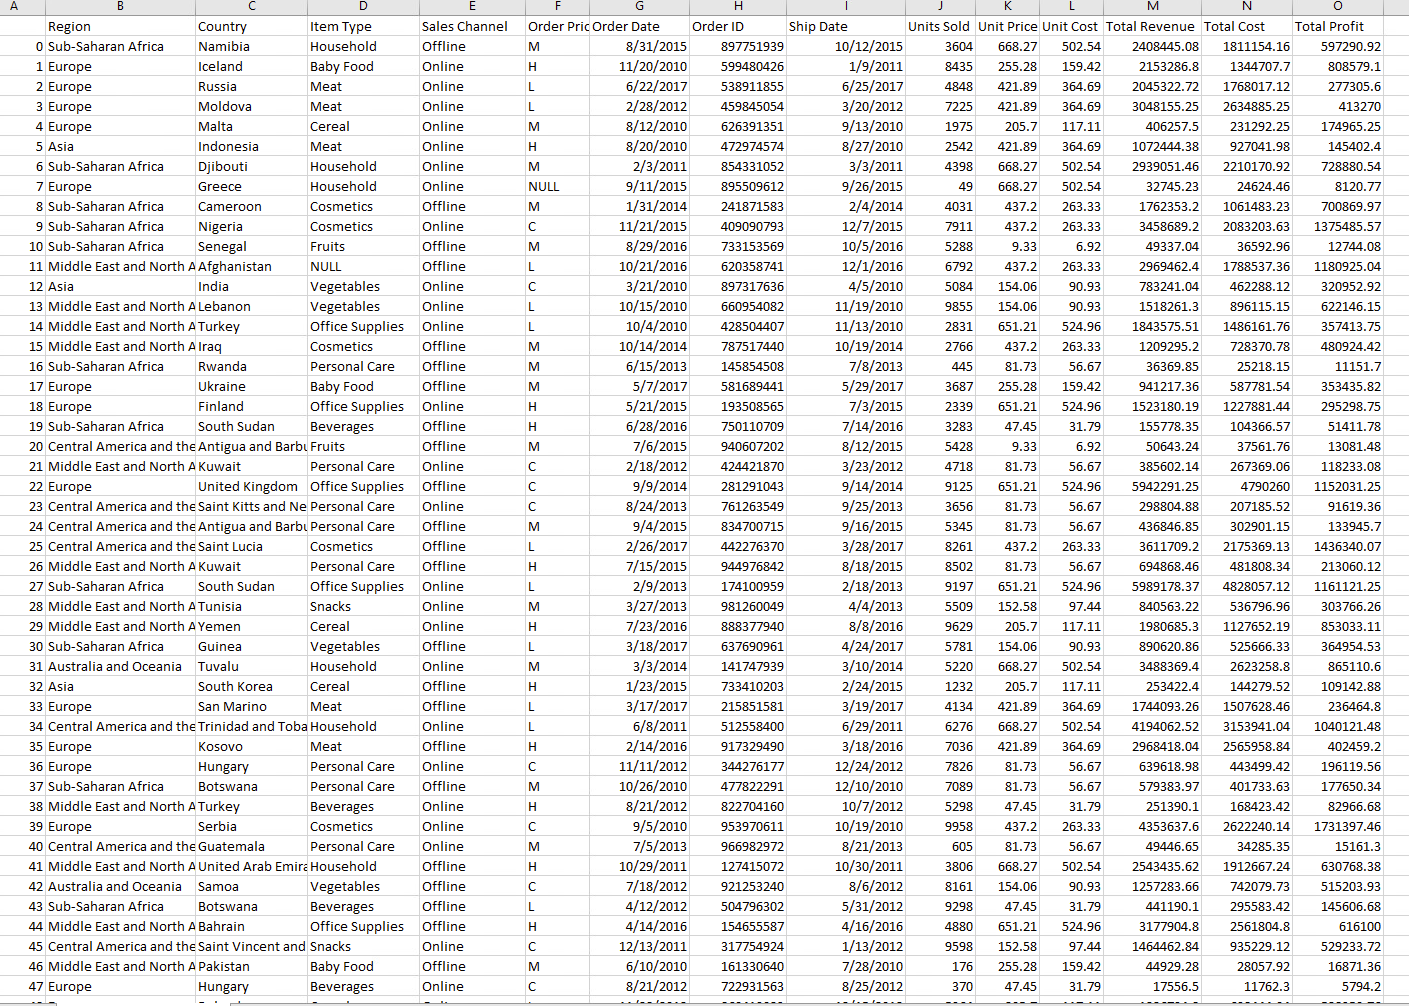
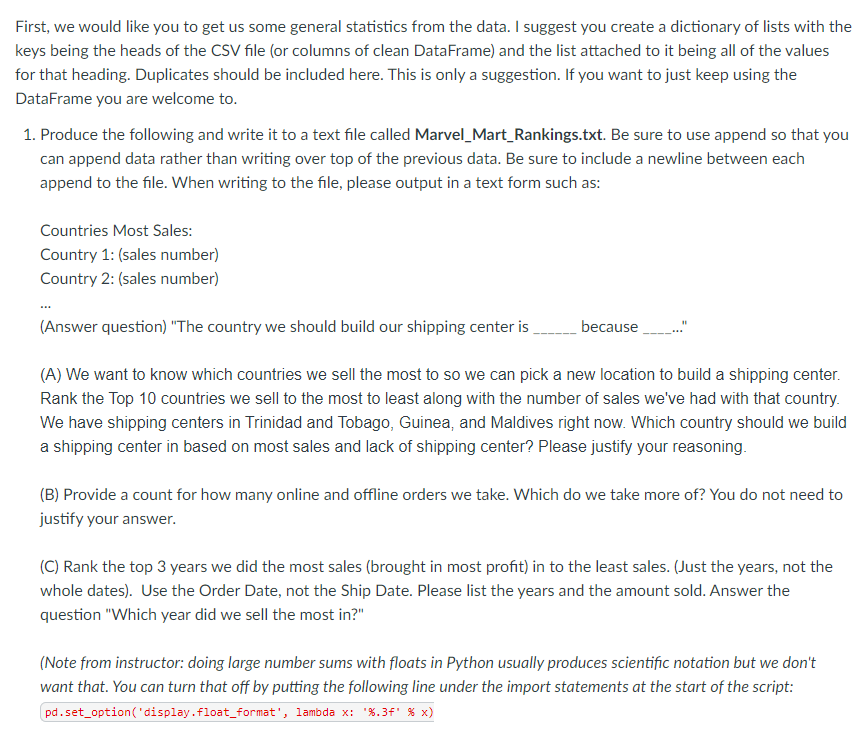
A B C Region 0 Sub-Saharan Africa 1 Europe 2 Europe 3 Europe 4 Europe 5 Asia 6 Sub-Saharan Africa 7 Europe 8 Sub-Saharan Africa 9 Sub-Saharan Africa 10 Sub-Saharan Africa 11 Middle East and North A Afghanistan 12 Asia Country Namibia Iceland Russia Moldova 17 Europe 18 Europe 19 Sub-Saharan Africa Malta Indonesia Djibouti Greece Cameroon Nigeria Senegal India 13 Middle East and North A Lebanon 14 Middle East and North A Turkey 15 Middle East and North A Iraq 16 Sub-Saharan Africa D Item Type Household Baby Food Meat Meat Cereal Meat Household Household Cosmetics Cosmetics Fruits NULL Vegetables Vegetables Office Supplies Cosmetics Personal Care Baby Food Office Supplies Beverages Rwanda Ukraine Finland South Sudan 20 Central America and the Antigua and Barbu Fruits 21 Middle East and North A Kuwait 22 Europe Offline Online Personal Care United Kingdom Office Supplies 23 Central America and the Saint Kitts and Ne Personal Care 24 Central America and the Antigua and Barbu Personal Care 25 Central America and the Saint Lucia Cosmetics 26 Middle East and North A Kuwait Offline Offline Personal Care South Sudan Offline Office Supplies Online Snacks Online Cereal Online Offline Online 27 Sub-Saharan Africa 28 Middle East and North A Tunisia 29 Middle East and North A Yemen 30 Sub-Saharan Africa Guinea 31 Australia and Oceania Tuvalu 32 Asia South Korea San Marino 33 Europe 34 Central America and the Trinidad and Toba Household 35 Europe Kosovo 36 Europe Hungary Botswana 37 Sub-Saharan Africa Vegetables Household Cereal Meat Meat Personal Care Personal Care E Sales Channel Offline Online Online Online 38 Middle East and North A Turkey 39 Europe Serbia 40 Central America and the Guatemala 41 Middle East and North A United Arab 42 Australia and Oceania Samoa 43 Sub-Saharan Africa Botswana 44 Middle East and North A Bahrain 45 Central America and the Saint Vincent and Snacks 46 Middle East and North A Pakistan Baby Food Beverages 47 Europe Hungary Online Online Online Online Offline Online Offline Offline Online Online Online Offline Offline Offline Online Offline Offline Online Online Offline Online Offline Online Online Online Offline Offline Offline Office Supplies Offline Online Offline Online Beverages Cosmetics Personal Care Emira Household Vegetables Beverages Offline Offline F G Order Pric Order Date M H L L M H M NULL M M L C L L M MMHIMU UUMLIJ MIJ MIJLIUMI H C M H C L H C M C H Order ID 8/31/2015 897751939 854331052 895509612 11/20/2010 599480426 6/22/2017 538911855 2/28/2012 459845054 8/12/2010 626391351 8/20/2010 472974574 2/3/2011 9/11/2015 1/31/2014 11/21/2015 8/29/2016 10/21/2016 620358741 3/21/2010 897317636 660954082 428504407 241871583 409090793 733153569 10/15/2010 10/4/2010 10/14/2014 787517440 6/15/2013 145854508 5/7/2017 581689441 5/21/2015 193508565 6/28/2016 750110709 7/6/2015 940607202 2/18/2012 424421870 9/9/2014 281291043 8/24/2013 761263549 9/4/2015 834700715 2/26/2017 442276370 7/15/2015 944976842 2/9/2013 174100959 3/27/2013 981260049 7/23/2016 888377940 3/18/2017 637690961 3/3/2014 141747939 1/23/2015 733410203 3/17/2017 215851581 6/8/2011 512558400 2/14/2016 917329490 11/11/2012 344276177 10/26/2010 477822291 8/21/2012 822704160 9/5/2010 953970611 7/5/2013 966982972 10/29/2011 127415072 7/18/2012 921253240 4/12/2012 504796302 4/14/2016 12/13/2011 317754924 6/10/2010 161330640 8/21/2012 154655587 722931563 Ship Date 10/12/2015 1/9/2011 6/25/2017 3/20/2012 9/13/2010 8/27/2010 3/3/2011 9/26/2015 2/4/2014 12/7/2015 10/5/2016 12/1/2016 4/5/2010 11/19/2010 11/13/2010 10/19/2014 7/8/2013 5/29/2017 7/3/2015 7/14/2016 8/12/2015 3/23/2012 9/14/2014 9/25/2013 9/16/2015 3/28/2017 8/18/2015 2/18/2013 4/4/2013 8/8/2016 4/24/2017 3/10/2014 2/24/2015 3/19/2017 6/29/2011 3/18/2016 12/24/2012 12/10/2010 10/7/2012 10/19/2010 8/21/2013 10/30/2011 8/6/2012 5/31/2012 4/16/2016 1/13/2012 7/28/2010 8/25/2012 M N 174965.25 145402.4 320952.92 622146.15 357413.75 480924.42 11151.7 353435.82 295298.75 51411.78 K Units Sold Unit Price Unit Cost Total Revenue Total Cost 3604 668.27 502.54 2408445.08 1811154.16 8435 255.28 159.42 2153286.8 1344707.7 4848 421.89 364.69 2045322.72 1768017.12 7225 421.89 364.69 3048155.25 2634885.25 1975 205.7 117.11 406257.5 231292.25 2542 421.89 364.69 1072444.38 927041.98 4398 668.27 502.54 2939051.46 2210170.92 728880.54 49 668.27 502.54 32745.23 24624.46 8120.77 4031 437.2 263.33 1762353.2 1061483.23 700869.97 7911 437.2 263.33 3458689.2 2083203.63 1375485.57 5288 9.33 6.92 49337.04 36592.96 12744.08 6792 437.2 263.33 2969462.4 1788537.36 1180925.04 5084 154.06 90.93 783241.04 462288.12 9855 154.06 90.93 1518261.3 896115.15 2831 651.21 524.96 1843575.51 1486161.76 2766 437.2 263.33 1209295.2 728370.78 445 81.73 56.67 36369.85 25218.15 3687 255.28 159.42 941217.36 587781.54 2339 651.21 524.96 1523180.19 1227881.44 3283 47.45 31.79 155778.35 104366.57 5428 9.33 6.92 50643.24 37561.76 4718 81.73 56.67 385602.14 267369.06 9125 651.21 524.96 5942291.25 4790260 3656 81.73 56.67 298804.88 207185.52 5345 81.73 56.67 436846.85 302901.15 8261 437.2 263.33 3611709.2 2175369.13 8502 81.73 56.67 694868.46 481808.34 9197 651.21 524.96 5989178.37 4828057.12 5509 152.58 97.44 840563.22 536796.96 9629 205.7 117.11 1980685.3 1127652.19 5781 154.06 90.93 890620.86 525666.33 5220 668.27 502.54 3488369.4 2623258.8 1232 205.7 117.11 253422.4 144279.52 109142.88 4134 421.89 364.69 1744093.26 1507628.46 236464.8 6276 668.27 502.54 4194062.52 3153941.04 1040121.48 7036 421.89 364.69 2968418.04 2565958.84 402459.2 7826 81.73 56.67 639618.98 443499.42 196119.56 7089 81.73 56.67 579383.97 401733.63 177650.34 5298 47.45 31.79 251390.1 168423.42 82966.68 9958 437.2 263.33 4353637.6 2622240.14 1731397.46 605 81.73 56.67 49446.65 34285.35 15161.3 3806 668.27 502.54 2543435.62 1912667.24 630768.38 8161 154.06 90.93 515203.93 9298 47.45 31.79 145606.68 4880 651.21 524.96 9598 152.58 97.44 176 255.28 159.42 370 47.45 31.79 13081.48 118233.08 1152031.25 91619.36 133945.7 1436340.07 213060.12 1161121.25 303766.26 853033.11 364954.53 865110.6 1257283.66 742079.73 295583.42 2561804.8 616100 441190.1 3177904.8 1464462.84 44929.28 935229.12 28057.92 529233.72 16871.36 5794.2 17556.5 11762.3 O Total Profit 597290.92 808579.1 277305.6 413270 First, we would like you to get us some general statistics from the data. I suggest you create a dictionary of lists with the keys being the heads of the CSV file (or columns of clean DataFrame) and the list attached to it being all of the values for that heading. Duplicates should be included here. This is only a suggestion. If you want to just keep using the DataFrame you are welcome to. 1. Produce the following and write it to a text file called Marvel_Mart_Rankings.txt. Be sure to use append so that you can append data rather than writing over top of the previous data. Be sure to include a newline between each append to the file. When writing to the file, please output in a text form such as: Countries Most Sales: Country 1: (sales number) Country 2: (sales number) (Answer question) "The country we should build our shipping center is because (A) We want to know which countries we sell the most to so we can pick a new location to build a shipping center. Rank the Top 10 countries we sell to the most to least along with the number of sales we've had with that country. We have shipping centers in Trinidad and Tobago, Guinea, and Maldives right now. Which country should we build a shipping center in based on most sales and lack of shipping center? Please justify your reasoning. (B) Provide a count for how many online and offline orders we take. Which do we take more of? You do not need to justify your answer. (C) Rank the top 3 years we did the most sales (brought in most profit) in to the least sales. (Just the years, not the whole dates). Use the Order Date, not the Ship Date. Please list the years and the amount sold. Answer the question "Which year did we sell the most in?" (Note from instructor: doing large number sums with floats in Python usually produces scientific notation but we don't want that. You can turn that off by putting the following line under the import statements at the start of the script: pd.set_option('display.float_format', lambda x: '%.3f' % x)
Step by Step Solution
3.37 Rating (150 Votes )
There are 3 Steps involved in it
To solve these questions you can perform the following steps using Python and the Pandas library Step 1 Setup First make sure you have Pandas installe... View full answer

Get step-by-step solutions from verified subject matter experts