

Question: Use Python to solve the following question. 2. Linear Regression Download and read the document that explains how to summarize a dataset using a function
Use Python to solve the following question.
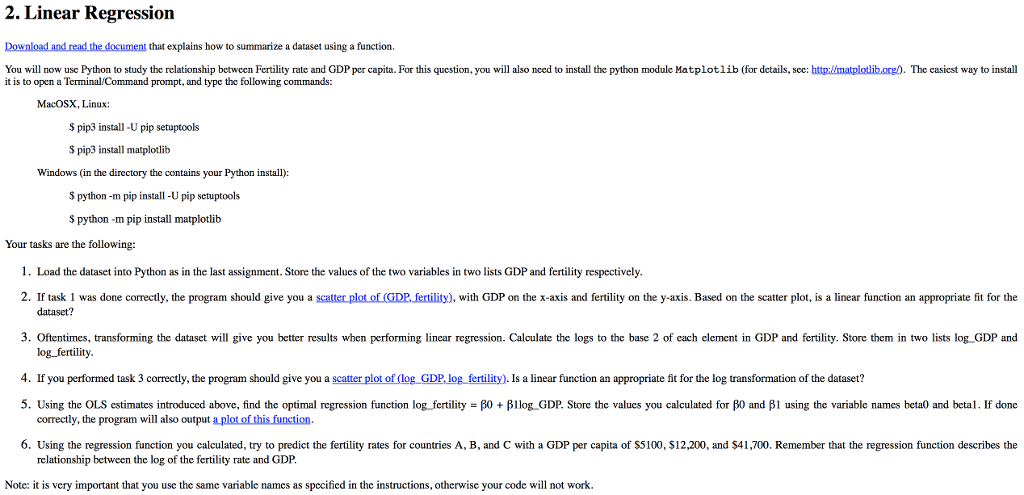
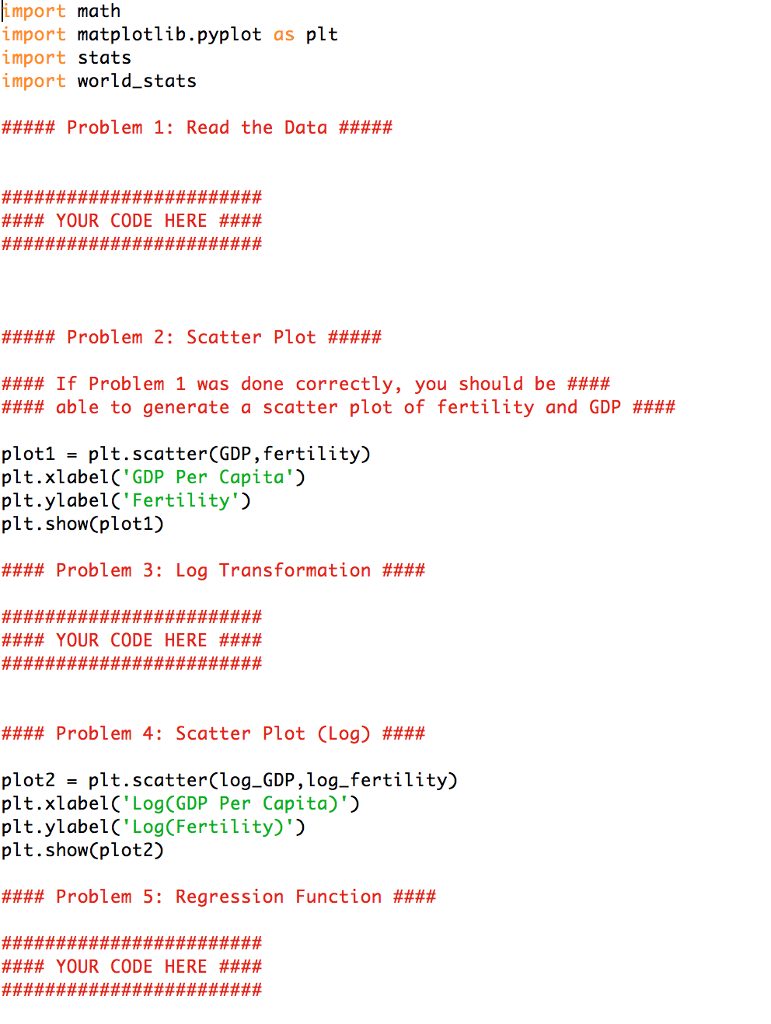
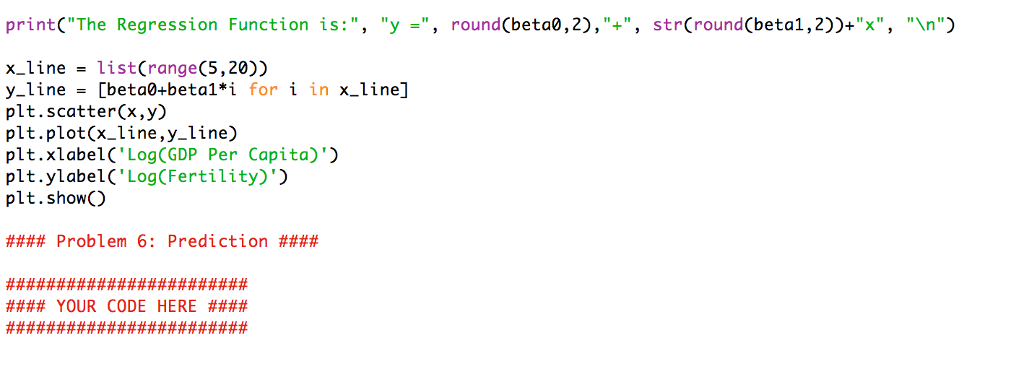
2. Linear Regression Download and read the document that explains how to summarize a dataset using a function You will now use Python to study the relationship between Fertility rate and GDP per capita. For this question, you will also need to install the python module Matplotlib (for details, sce: httplimatplotlib.org). The casiest way to install it is to open a Terminal/Command prompt, and type the following commands: MacOSX, Linux: $pip3 inst-U pip setuptools pip3 instal matplotlib Windows (in the directory the contains your Python install): $ python -m pip install -U pip setuptools $ python -m pip install matplotlib Your tasks are the following: 1 Load the dataset into Python as in the last assignment. Store the values of the two variables in two lists GDP and fertility respectively. 2. If task 1 was done correctly, the program should give you a scatter plot of (GDP fertility), with GDP on the x-axis and fertility on the y-axis. Based on the scatter plot, is a linear function an appropriate fit for the dataset? 3. Oftentimes, transforming the dataset will give you better results when performing linear regression. Calculate the logs to the base 2 of cach element in GDP and fertility. Store them in two lists log GDP and log fertility. 4. If you performed task 3 correctly, the program should give you a scatter plot of (log GDP, log fertility). Is a linear function an appropriate fit for the log transformation of the dataset? 5. Using the OLS estimates introduced above, find the optimal regression function log fertility-oBllog GDP. Store the values you calculated for BO and B1 using the variable names beta0 and betal. If done correctly, the program will also output a plot of this function. 6. Using the regression function you calculated, try to predict the fertility rates for countries A, B, and C with a GDP per capita of s5100, $12.200, and $41,700. Remember that the regression function deseribes the relationship between the log of the fertility rate and GDP. Note: it is very important that you use the same variable names as specified in the instructions, otherwise your code will not work. 2. Linear Regression Download and read the document that explains how to summarize a dataset using a function You will now use Python to study the relationship between Fertility rate and GDP per capita. For this question, you will also need to install the python module Matplotlib (for details, sce: httplimatplotlib.org). The casiest way to install it is to open a Terminal/Command prompt, and type the following commands: MacOSX, Linux: $pip3 inst-U pip setuptools pip3 instal matplotlib Windows (in the directory the contains your Python install): $ python -m pip install -U pip setuptools $ python -m pip install matplotlib Your tasks are the following: 1 Load the dataset into Python as in the last assignment. Store the values of the two variables in two lists GDP and fertility respectively. 2. If task 1 was done correctly, the program should give you a scatter plot of (GDP fertility), with GDP on the x-axis and fertility on the y-axis. Based on the scatter plot, is a linear function an appropriate fit for the dataset? 3. Oftentimes, transforming the dataset will give you better results when performing linear regression. Calculate the logs to the base 2 of cach element in GDP and fertility. Store them in two lists log GDP and log fertility. 4. If you performed task 3 correctly, the program should give you a scatter plot of (log GDP, log fertility). Is a linear function an appropriate fit for the log transformation of the dataset? 5. Using the OLS estimates introduced above, find the optimal regression function log fertility-oBllog GDP. Store the values you calculated for BO and B1 using the variable names beta0 and betal. If done correctly, the program will also output a plot of this function. 6. Using the regression function you calculated, try to predict the fertility rates for countries A, B, and C with a GDP per capita of s5100, $12.200, and $41,700. Remember that the regression function deseribes the relationship between the log of the fertility rate and GDP. Note: it is very important that you use the same variable names as specified in the instructions, otherwise your code will not work
Step by Step Solution
There are 3 Steps involved in it

Get step-by-step solutions from verified subject matter experts