

Question: Python The function square_wave (x) is defined by [ text { square_wave }(x)=left{begin{array}{ll} -pi / 4 & x2 pi end{array} ight. ] Plot the graph
 Python
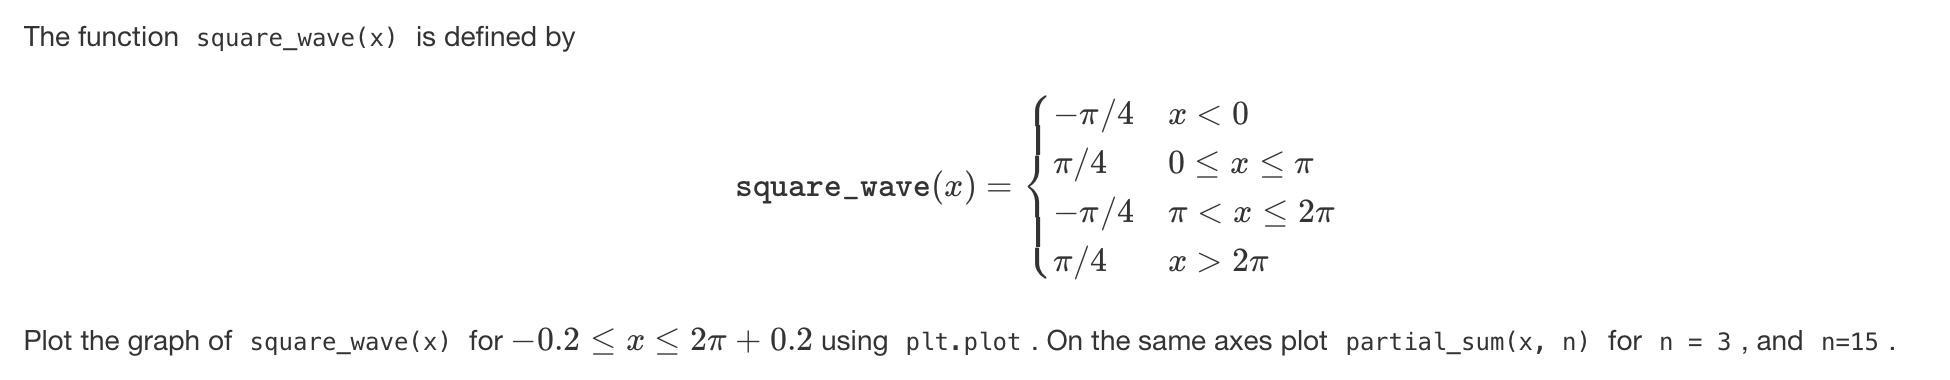
The function square_wave (x) is defined by \[ \text { square_wave }(x)=\left\{\begin{array}{ll} -\pi / 4 & x2 \pi \end{array} ight. \] Plot the graph of square_wave (x) for 0.2x2+0.2 using plt.plot. On the same axes plot partial_sum (x,n) for n=3, and n=15
Step by Step Solution
There are 3 Steps involved in it
1 Expert Approved Answer
Step: 1 Unlock

Question Has Been Solved by an Expert!
Get step-by-step solutions from verified subject matter experts
Step: 2 Unlock
Step: 3 Unlock