

Question: Python You are a stock analyst. It is too slow to view the charts one at a time. You want to present the stocks of
Python
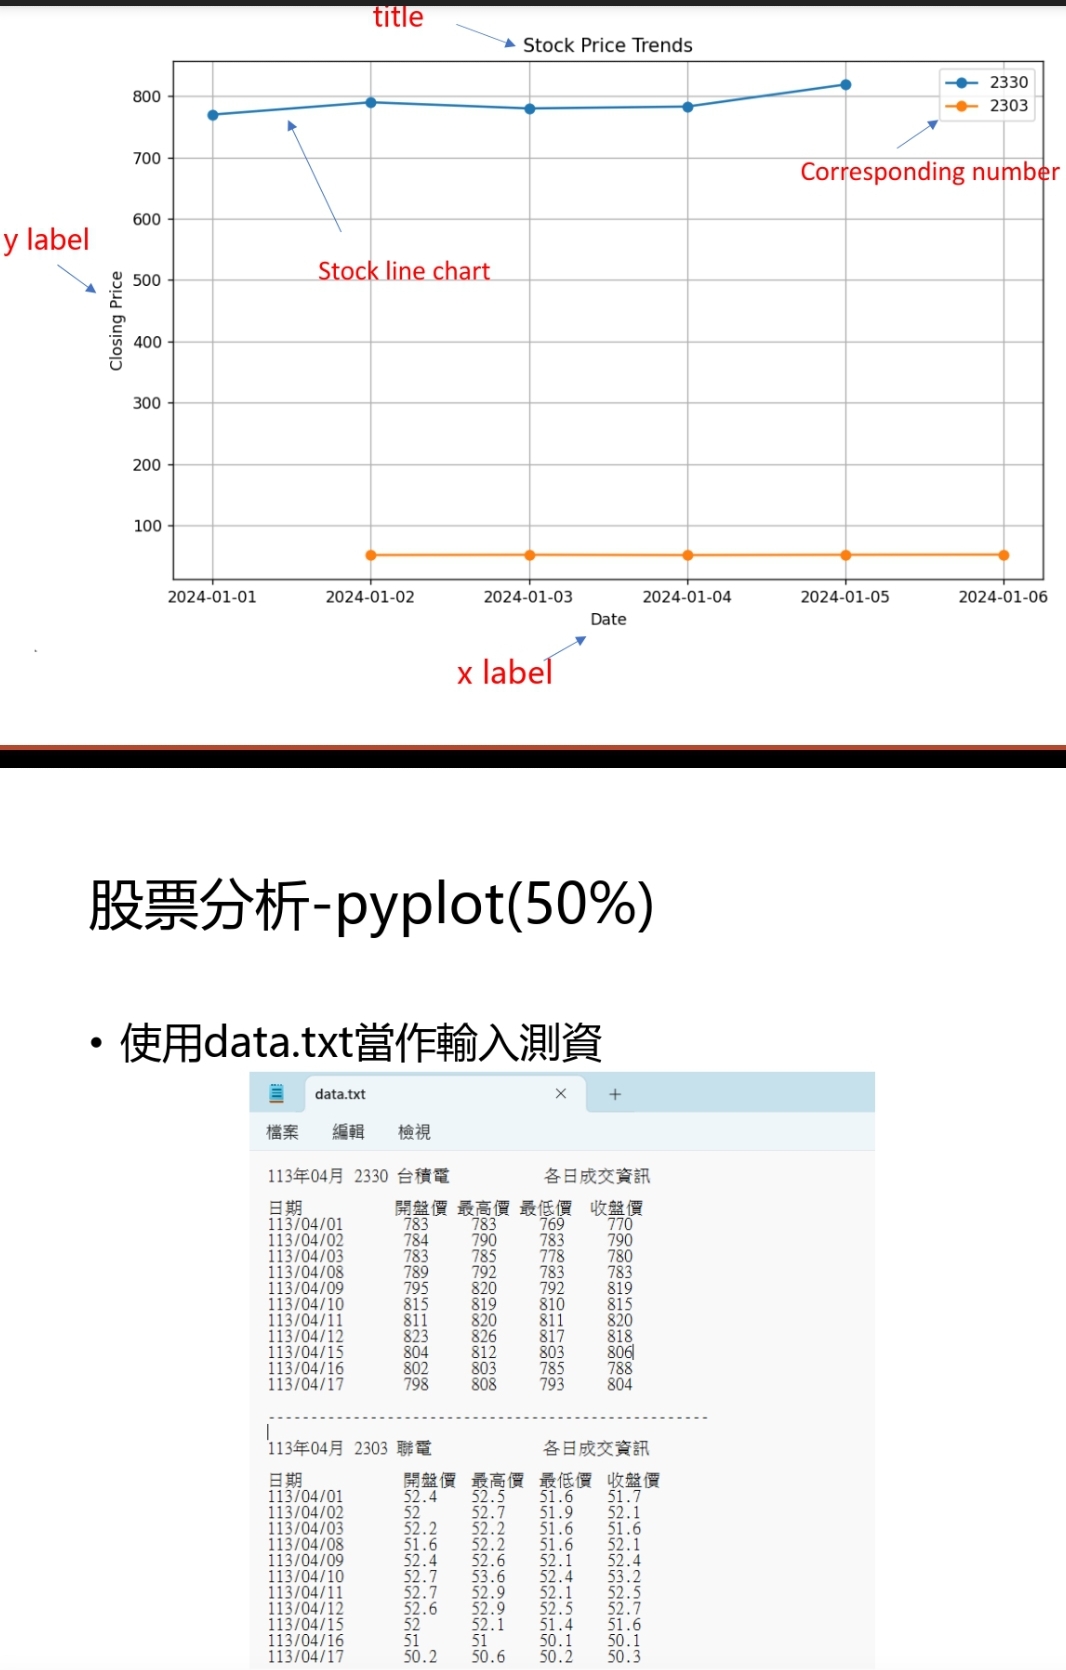
You are a stock analyst. It is too slow to view the charts one at a time. You want to present the stocks of two companies in one chart at the same time, but the data you get contains a lot of unnecessary information. please filter it before making it into a picture.
In addition, some information must be presented in the chart: x y label, title
x and y axis coordinate units
Chart turning points
Stock line chart and corresponding numbers
Step by Step Solution
There are 3 Steps involved in it
1 Expert Approved Answer
Step: 1 Unlock

Question Has Been Solved by an Expert!
Get step-by-step solutions from verified subject matter experts
Step: 2 Unlock
Step: 3 Unlock