

Question: python-spyder coding needed Implement a function called func1 such that: func1 has 1 input: integer n (you can assumen 23, no need for error checking)
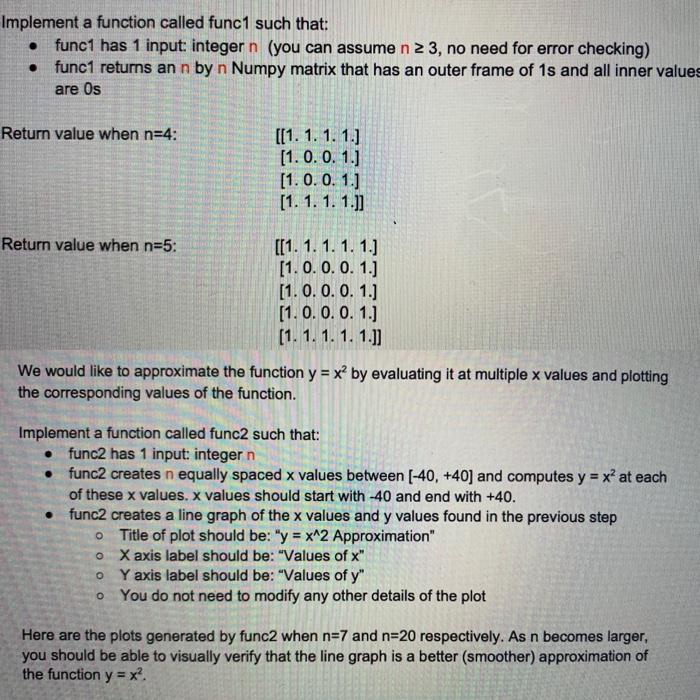
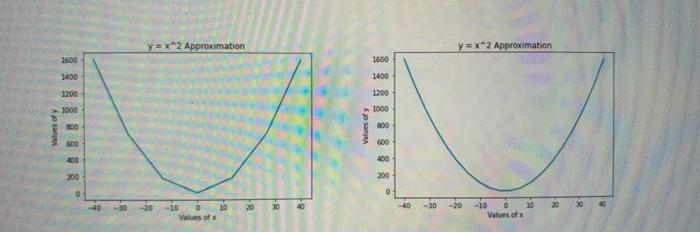
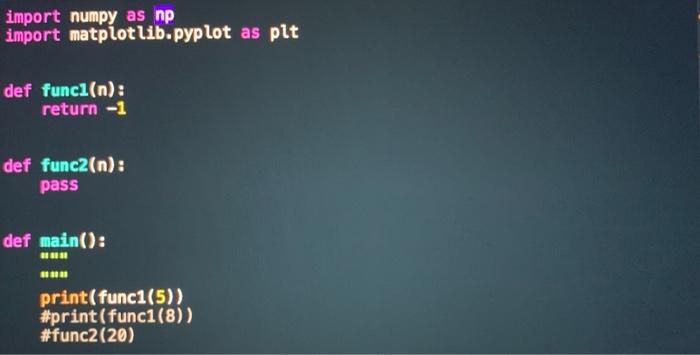
Implement a function called func1 such that: func1 has 1 input: integer n (you can assumen 23, no need for error checking) func1 returns an n by n Numpy matrix that has an outer frame of 1s and all inner values are Os Return value when n=4: [[1. 1. 1. 1.] [1.0.0.1.] [1.0.0. 1.] [1. 1. 1. 1.] Return value when n=5: [[1.1.1.1.1.] [1.0.0.0.1.) [1.0.0.0.1.) [1.0.0.0.1.) (1. 1. 1. 1. 1.]] We would like to approximate the function y = x2 by evaluating it at multiple x values and plotting the corresponding values of the function. Implement a function called func2 such that: func2 has 1 input: integer n func2 creates n equally spaced x values between (-40, +40) and computes y = x at each of these x values. x values should start with -40 and end with +40. func2 creates a line graph of the x values and y values found in the previous step o Title of plot should be: "y = x^2 Approximation" X axis label should be: "Values of x" o Y axis label should be: "Values of y" o You do not need to modify any other details of the plot o Here are the plots generated by func2 when n=7 and n=20 respectively. As n becomes larger, you should be able to visually verify that the line graph is a better (smoother) approximation of the function y = x? y = x2 Approximation y = x2 Approximation 1600 1600 1400 1200 1400 1200 1000 1000 Values of 500 Values of y 800 600 600 400 200 200 200 30 -20 10 20 -10 Values of -10 Values of import numpy as np import matplotlib.pyplot as plt def func1(n): return -1 def func2(n): pass def main(): 3181 print(func1(5)) #print(func1(8)) #func2(20)
Step by Step Solution
There are 3 Steps involved in it

Get step-by-step solutions from verified subject matter experts