

Question: Q 1 0 ( b ) : Recreate the R code necessary to generate the following graph. Q 1 0 ( c ) : Recreate
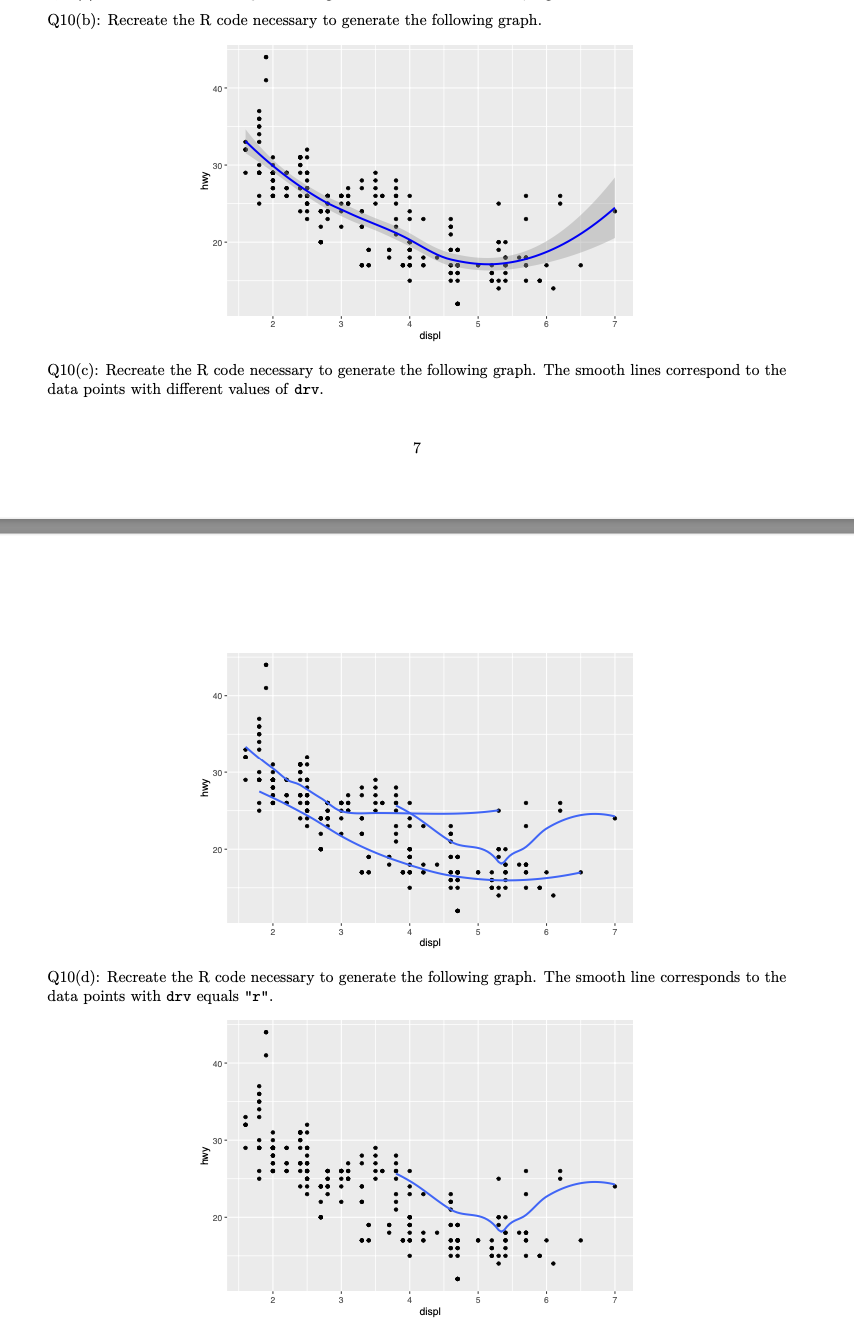
Qb: Recreate the code necessary to generate the following graph.
Qc: Recreate the R code necessary to generate the following graph. The smooth lines correspond to the
data points with different values of drv
Qd: Recreate the R code necessary to generate the following graph. The smooth line corresponds to the
data points with drv equals r
Try to use code eg read.csv to import the data as some of you did
Step by Step Solution
There are 3 Steps involved in it
1 Expert Approved Answer
Step: 1 Unlock

Question Has Been Solved by an Expert!
Get step-by-step solutions from verified subject matter experts
Step: 2 Unlock
Step: 3 Unlock