

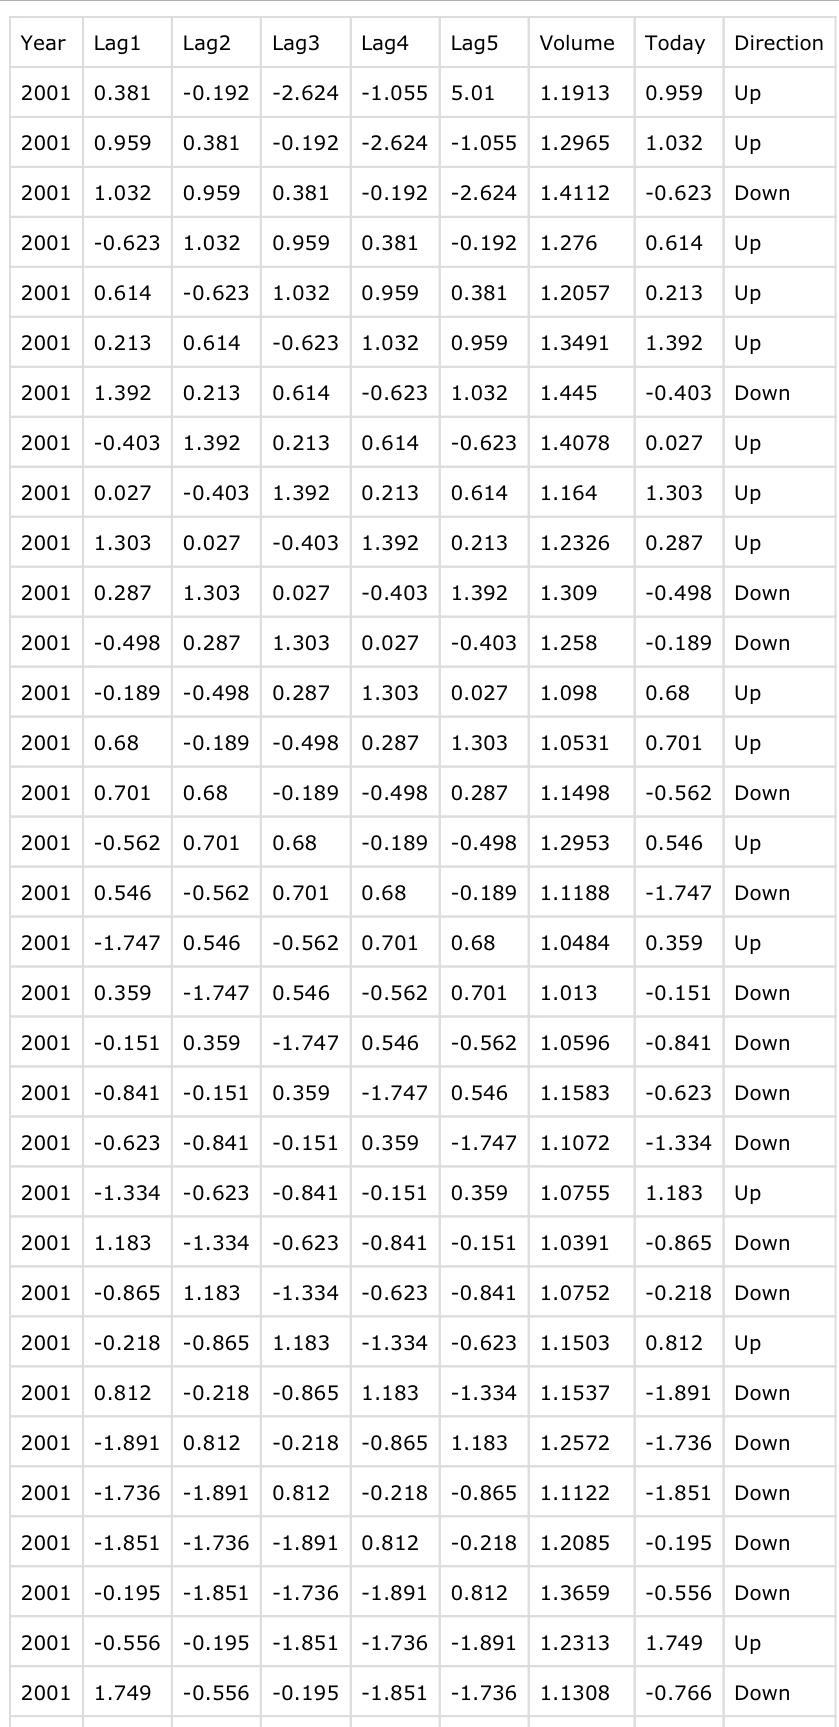
Question: Q 1 - 1 . Find the summary statistics ( mean , quartiles, min / max , etc ) of each of the variables. Answer:
Q Find the summary statistics mean quartiles, minmax etc of each of the variables. Answer:
Q Find all of the pairwise correlations in the data set. Can you find significant correlations between variables? Answer:
Step: Linear Regression
Q Try to fit a linear regression model in order to predict Today using other variables excluding Direction Explain the regression result. How can you interpret coefficients, their pvalues, and Rsquared?import statsmodels.api as sm ## Use OLS function to fit a linear regression model## X is a DataFrame or numpy array containing exogenous independent variables.## Y is a Series or numpy array of dependent variable.model smOLSY Xfitpredictions model.predictXprintmodel model.summary Answer:
Q Try to fit a linear regression model in order to predict Direction using other variables excluding Today Note that you need to convert the factor data Direction into numeric data type.Explain the regression result. How can you interpret coefficients, their pvalues, and adjusted Rsquared?Answer:
Q Try to fit a linear regression model in order to predict Direction using Lag and Lag Explain the regression result. How can you interpret coefficients, their pvalues, and adjusted Rsquared?Answer:
Step: Logistic Regression
Q Try to fit a logistic regression model in order to predict Direction using other variables excluding Today Explain the regression result. How can you interpret coefficients and their pvalues?Answer:
Q Try to fit a logistic regression model in order to predict Direction using Lag and Lag Explain the regression result. How can you interpret coefficients and their pvalues?Answer:
Q Predict the probability that the market will go up given values of the predictors.Then, in order to make a prediction as to whether the market will go up or down on a particular day, we must convert these predicted probabilities into class labels, Up or Down. So create a new vector of predictions based on whether the predicted probability of a market increase is greater than or less than Then, tabulate the prediction vector to determine how many observations were correctly or incorrectly classified. What does this table imply about predictions of the logistic regression model?Answer:
Q The previous result in Q is misleading because we trained and tested the model on the same set of observations. In order to better assess the accuracy of the logistic regression, we can fit the model using part of the data, and then examine how well it predicts the held out data. Lets use data before for training and compute predictions for Now fit a logistic regression model using training data set, using the subset argument.Obtain predicted probabilities on the validation data set, that is for days in Tabulate the prediction vector to determine how many observations were correctly or incorrectly classified. How can you interpret the prediction accuracy?Answer: Q Repeat Q varying the threshold other than to determine predictions based on whether the predicted probability of a market increase is greater than or less than the threshold.Answer:
Step by Step Solution
There are 3 Steps involved in it
1 Expert Approved Answer
Step: 1 Unlock

Question Has Been Solved by an Expert!
Get step-by-step solutions from verified subject matter experts
Step: 2 Unlock
Step: 3 Unlock