

Question: Q 1 1 . Look at the following data: begin { tabular } { | l | c | c | c | c
Q Look at the following data:
begintabularlcccc
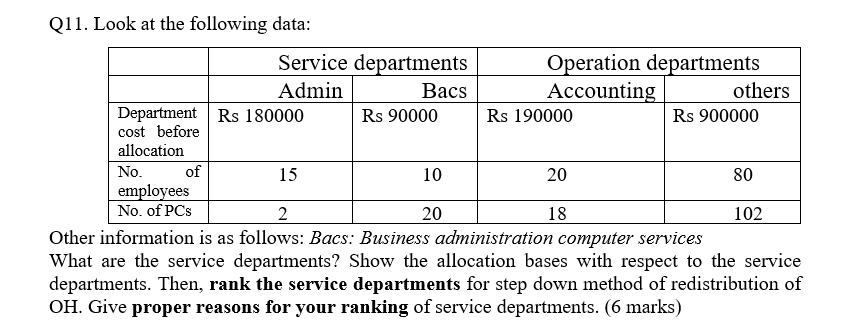
hline & multicolumnc Service departments & multicolumnc Operation departments
hline & Admin & Bacs & Accounting & others
hline begintabularl
Department
cost before
allocation
endtabular & Rs & Rs & Rs & Rs
hline begintabularl
No of
employees
endtabular & & & &
hline No of PCs & & & &
hline
endtabular
Other information is as follows: Bacs: Business administration computer services What are the service departments? Show the allocation bases with respect to the service departments. Then, rank the service departments for step down method of redistribution of OH Give proper reasons for your ranking of service departments. marks
Step by Step Solution
There are 3 Steps involved in it
1 Expert Approved Answer
Step: 1 Unlock

Question Has Been Solved by an Expert!
Get step-by-step solutions from verified subject matter experts
Step: 2 Unlock
Step: 3 Unlock