

Question: Q 1 1 ( Multiple graphs ) : The function ggarrange in the package ggpubr can be used to organize multiple graphs in a single
QMultiple graphs: The function ggarrange in the package ggpubr can be used to organize multiple
graphs in a single plot. For example,
libraryggpubr # install this first
library MASS
library tidyverse
plotnosmoke birthwt
filter smoke
aes
geomhistogram
plotsmoke birthwt
filtersmoke
ggplot
geomhistogram
ggarrangeplotnosmoke, plotsmoke
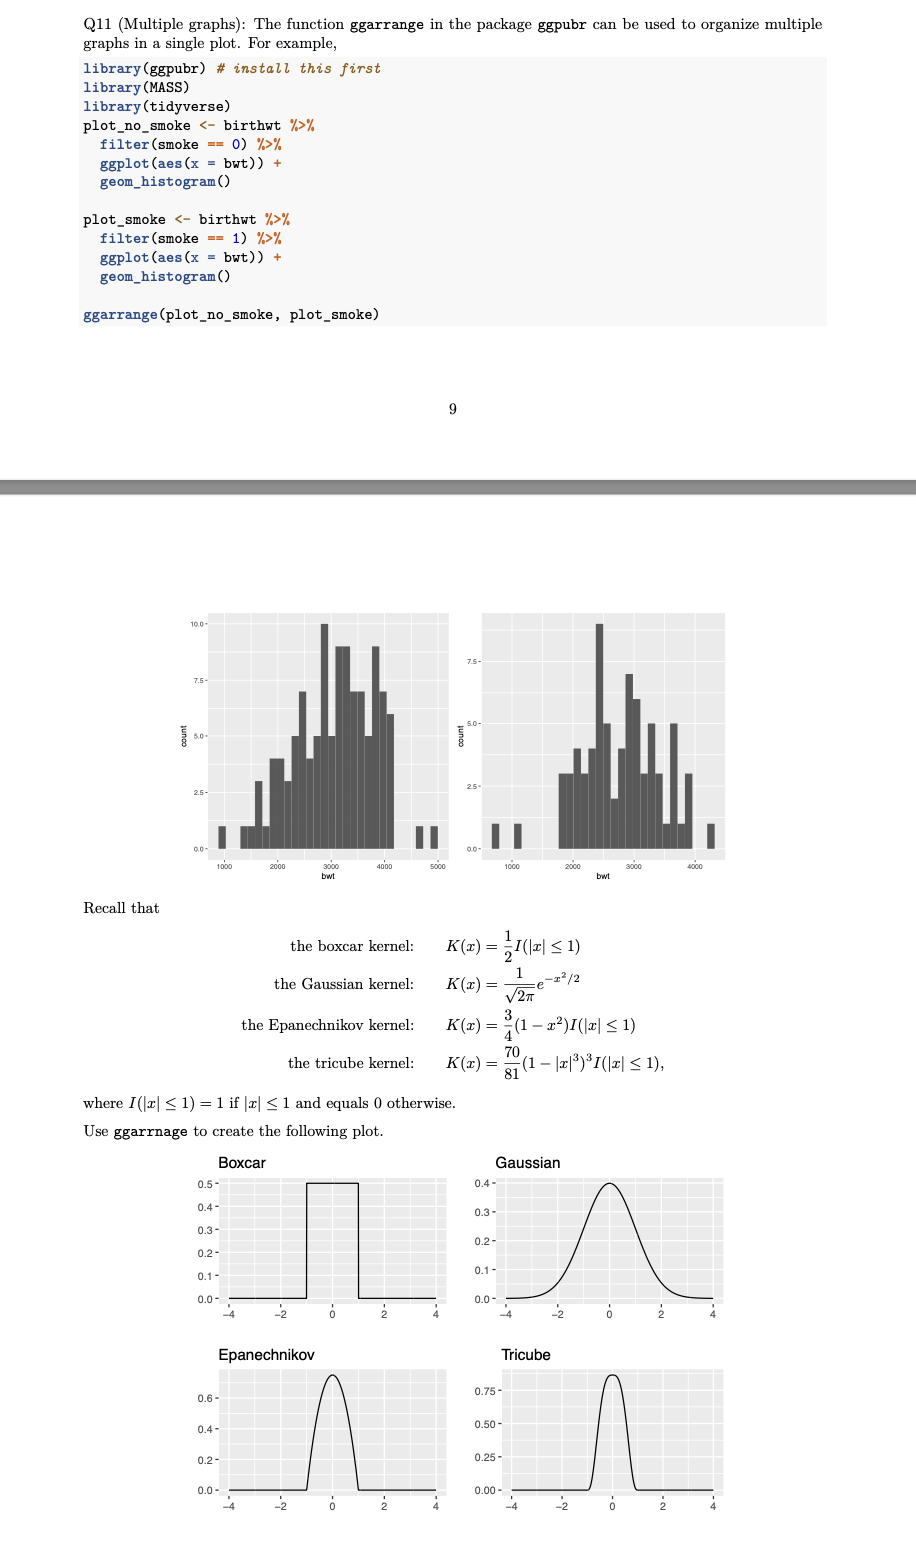
Recall that
the boxcar kernel:
the Gaussian kernel:
the Epanechnikov kernel:
the tricube kernel:
where if and equals otherwise.
Use ggarrnage to create the following plot.
Step by Step Solution
There are 3 Steps involved in it
1 Expert Approved Answer
Step: 1 Unlock

Question Has Been Solved by an Expert!
Get step-by-step solutions from verified subject matter experts
Step: 2 Unlock
Step: 3 Unlock