

Question: Q 1 . Imagine a graph depicting interconnected cities with edges representing their connections. In this graph, some nodes are marked in red to denote
Q Imagine a graph depicting interconnected cities with edges representing their connections. In this
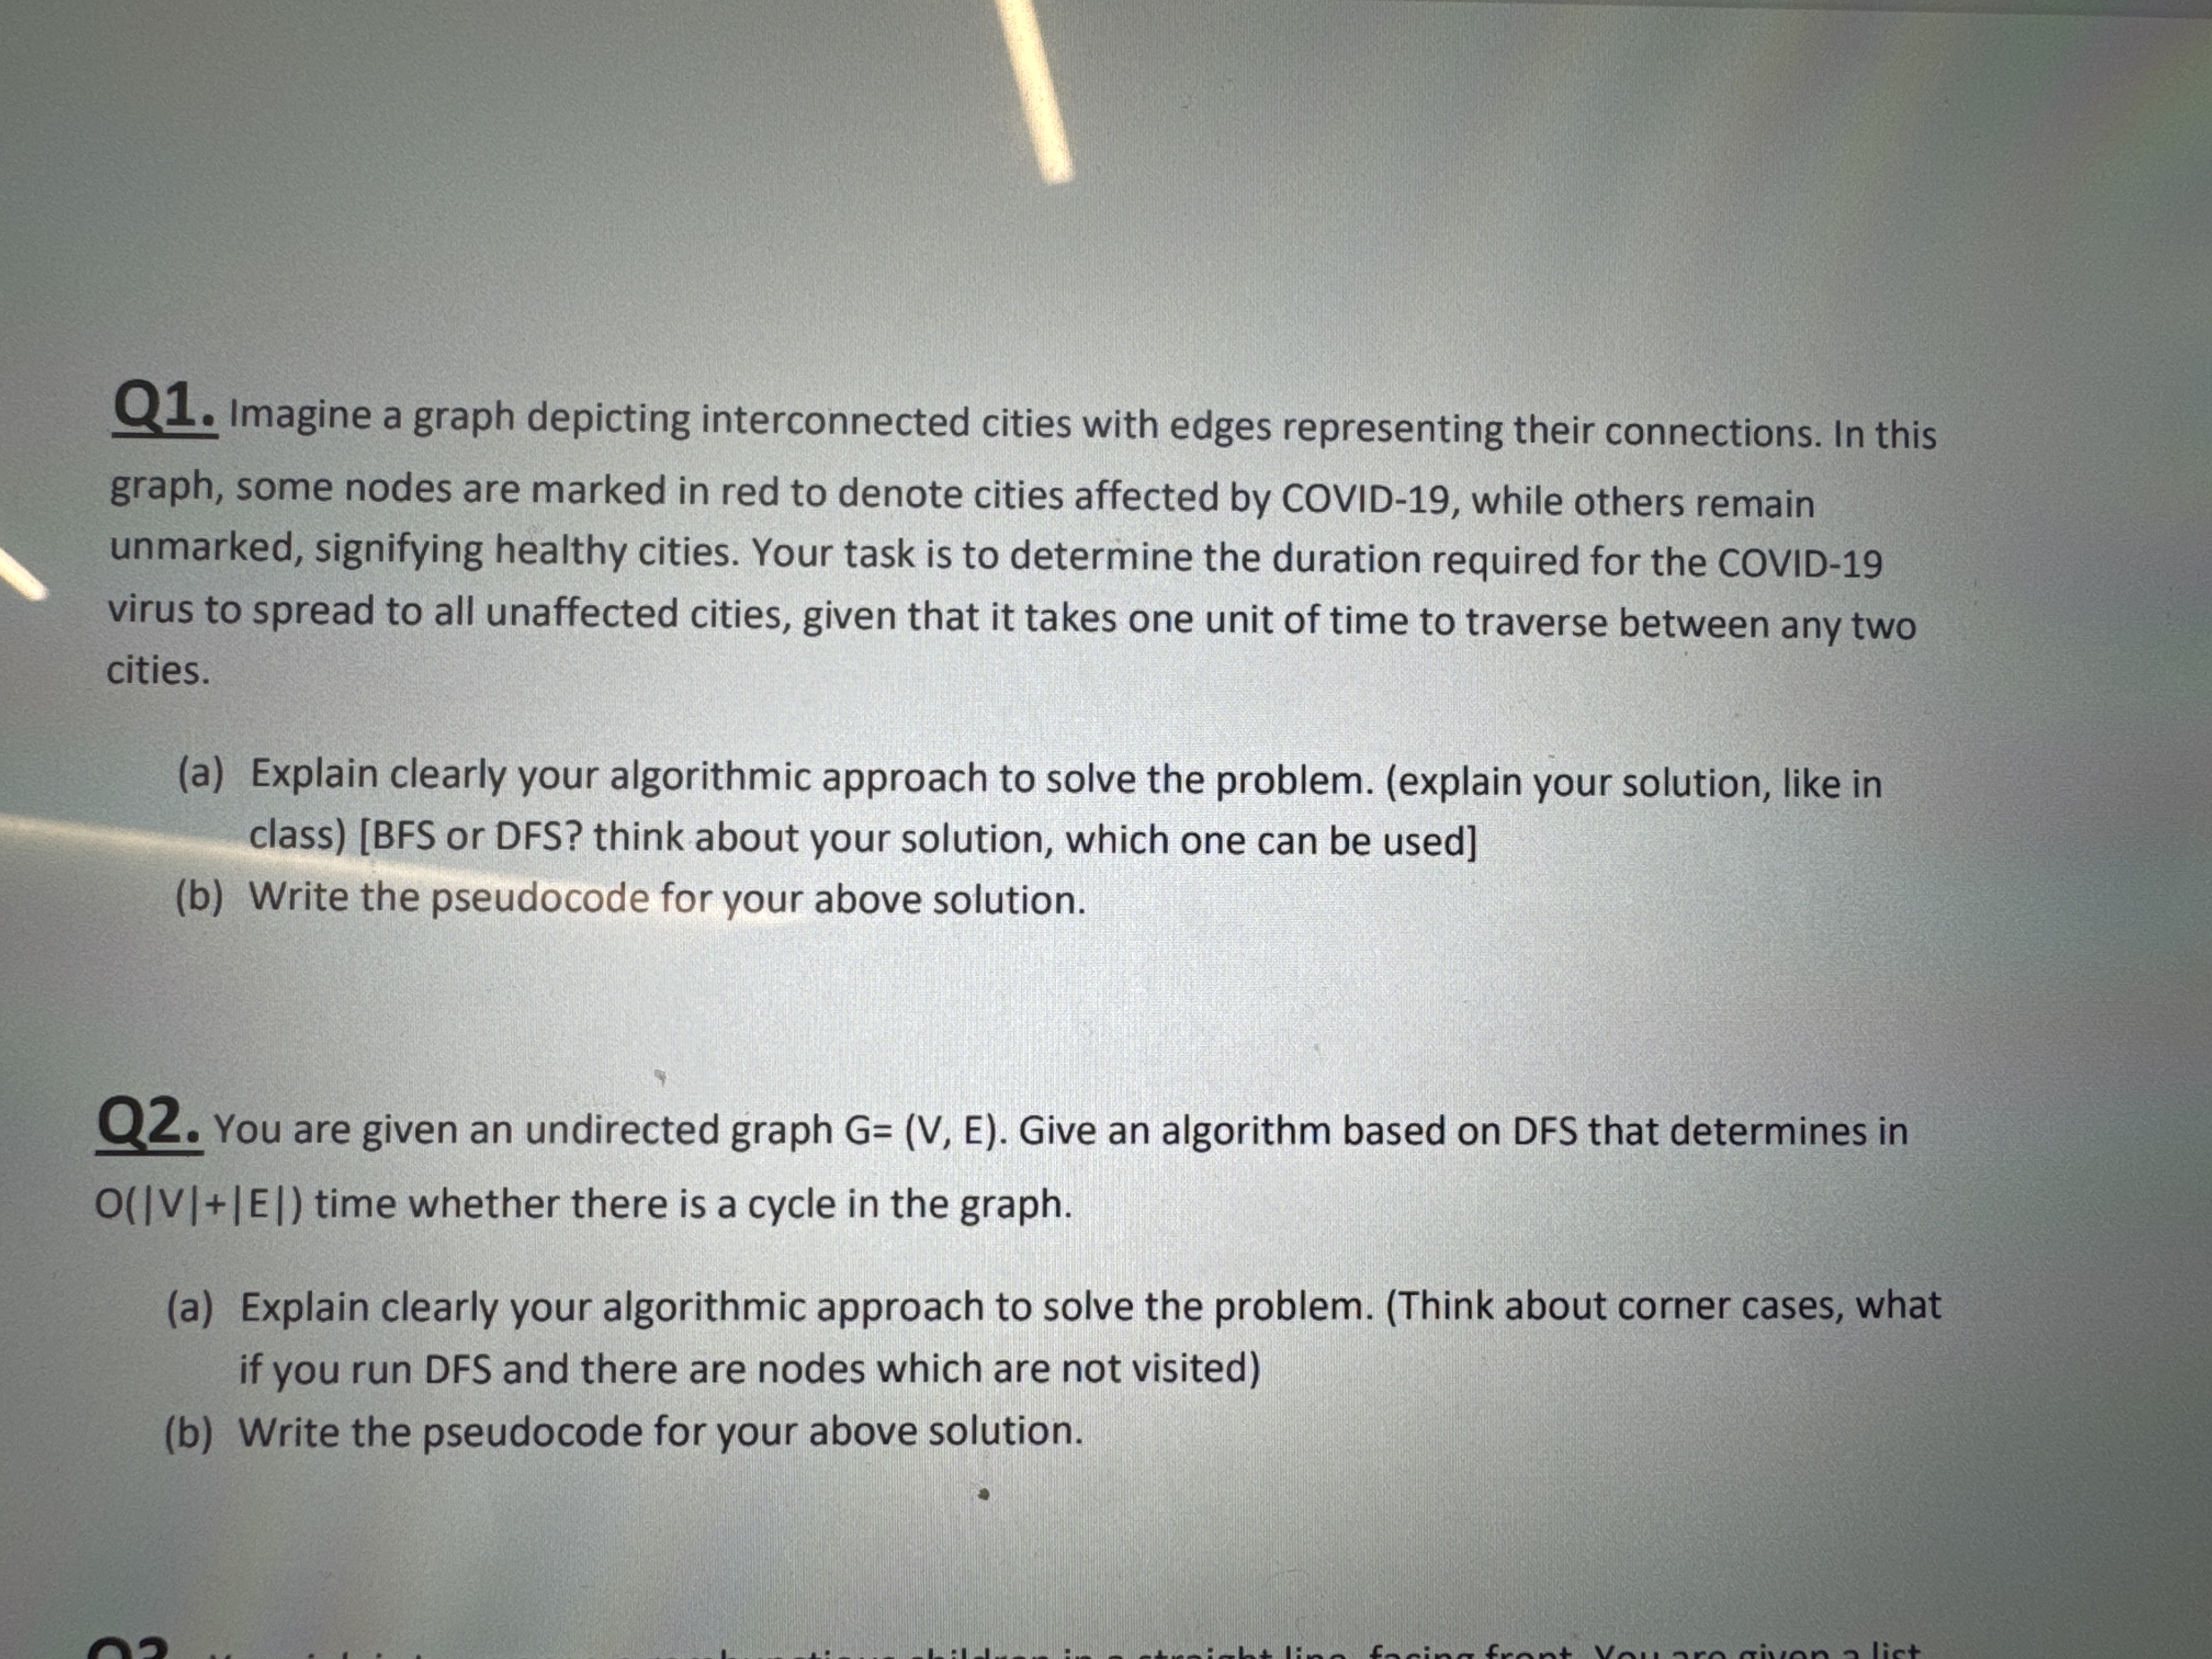
graph, some nodes are marked in red to denote cities affected by COVID while others remain
unmarked, signifying healthy cities. Your task is to determine the duration required for the COVID
virus to spread to all unaffected cities, given that it takes one unit of time to traverse between any two
cities.
a Explain clearly your algorithmic approach to solve the problem. explain your solution, like in
classBFS or DFS think about your solution, which one can be used
b Write the pseudocode for your above solution.
Q You are given an undirected graph Give an algorithm based on DFS that determines in
time whether there is a cycle in the graph.
a Explain clearly your algorithmic approach to solve the problem. Think about corner cases, what
if you run DFS and there are nodes which are not visited
b Write the pseudocode for your above solution.
Step by Step Solution
There are 3 Steps involved in it
1 Expert Approved Answer
Step: 1 Unlock

Question Has Been Solved by an Expert!
Get step-by-step solutions from verified subject matter experts
Step: 2 Unlock
Step: 3 Unlock