

Question: Q 11.16 A help desk devoted to student software prob- lems also receives phone calls. The number of persons that can be served in
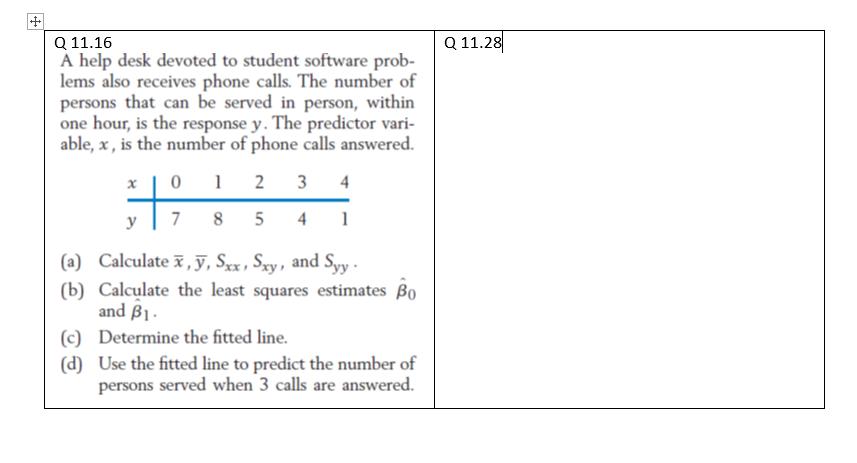
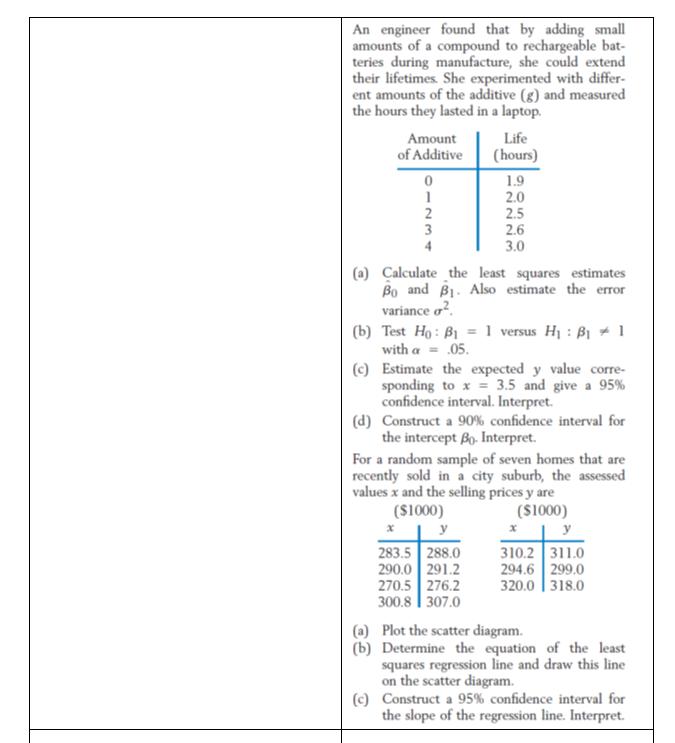
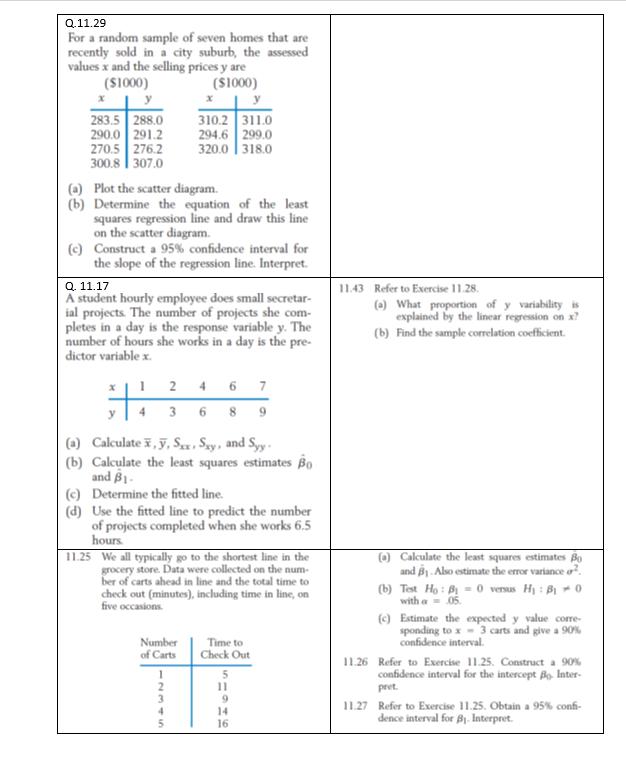
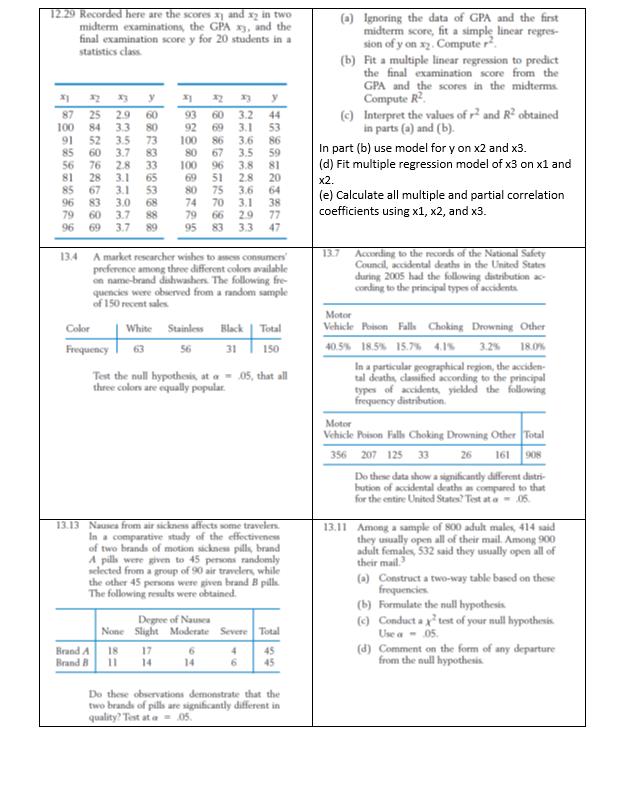
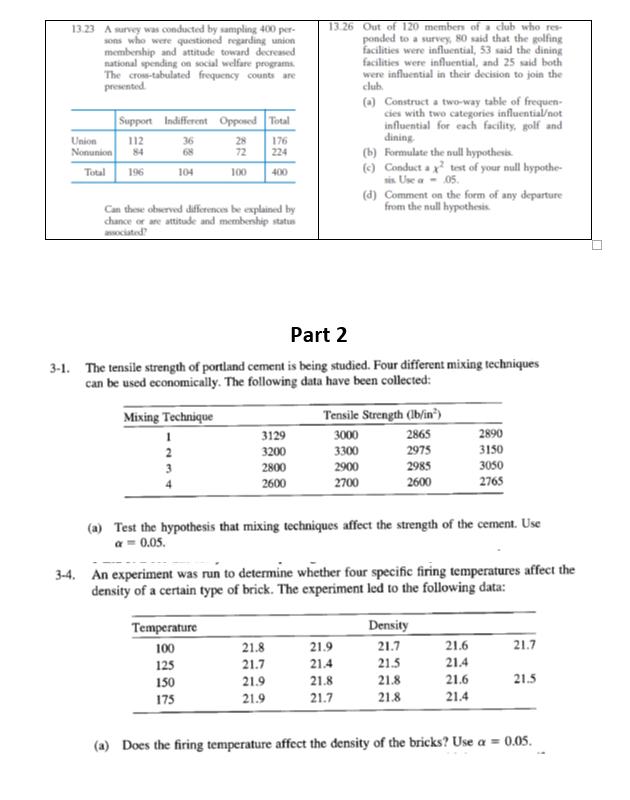
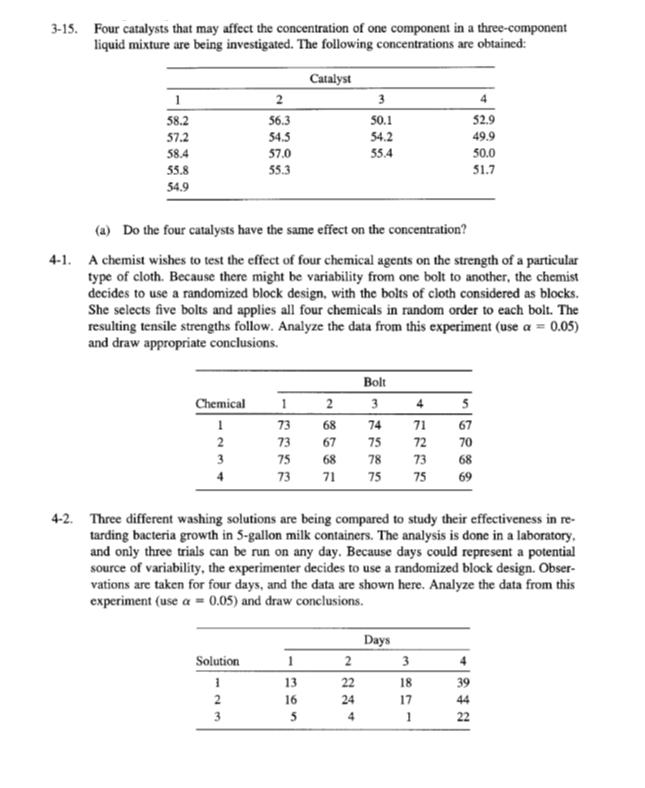
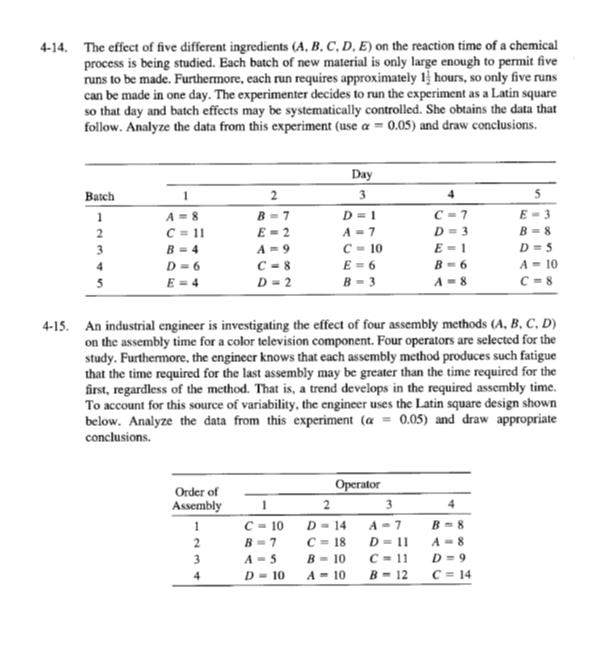
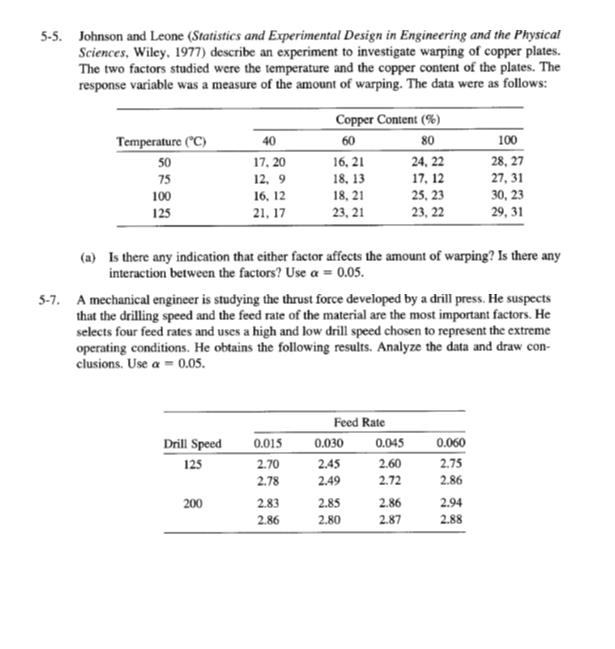

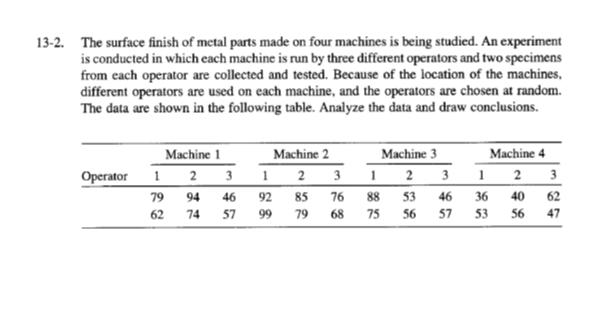
Q 11.16 A help desk devoted to student software prob- lems also receives phone calls. The number of persons that can be served in person, within one hour, is the response y. The predictor vari- able, x, is the number of phone calls answered. x 0 1 2 3 4 7 8 5 4 1 (a) Calculate x, y, Sxx, Sxy, and Syy- (b) Calculate the least squares estimates Bo and B1. (c) Determine the fitted line. (d) Use the fitted line to predict the number of persons served when 3 calls are answered. Q 11.28 An engineer found that by adding small amounts of a compound to rechargeable bat- teries during manufacture, she could extend their lifetimes. She experimented with differ- ent amounts of the additive (g) and measured the hours they lasted in a laptop. Amount of Additive (b) (c) 0 1 2 3 (a) Calculate the least squares estimates Bo and B. Also estimate the error variance Test Ho: B1 with a = .05. Life (hours) 1.9. 2.0 2.5 2.6 3.0 283.5 288.0 290.0 291.2 270.5 276.2 300.8 307.0 1 versus H B 1 Estimate the expected y value corre- sponding to x = 3.5 and give a 95% confidence interval. Interpret. (d) Construct a 90% confidence interval for the intercept Bo. Interpret. For a random sample of seven homes that are recently sold in a city suburb, the assessed values x and the selling prices y are ($1000) ($1000) xy 310.2 311.0 294.6 299.0 320.0 318.0 (a) Plot the scatter diagram. (b) Determine the equation of the least squares regression line and draw this line on the scatter diagram. (c) Construct a 95% confidence interval for the slope of the regression line. Interpret. Q.11.29 For a random sample of seven homes that are recently sold in a city suburb, the assessed values x and the selling prices y are ($1000) ($1000) x 283.5 288.0 290.0 291.2 270.5 276.2 300.8 307.0 (a) Plot the scatter diagram. (b) x Determine the equation of the least squares regression line and draw this line on the scatter diagram. (c) Construct a 95% confidence interval for the slope of the regression line. Interpret. 310.2 311.0 294.6 299.0 320.0 318.0 Q.11.17 A student hourly employee does small secretar- ial projects. The number of projects she com- pletes in a day is the response variable y. The number of hours she works in a day is the pre- dictor variable x. 1 2 4 4 3 Number of Carts (a) Calculate x, y, Sex, Sy, and Syy (b) Calculate the least squares estimates Bo and B1- (c) Determine the fitted line. (d) Use the fitted line to predict the number of projects completed when she works 6.5 hours. INMTin 11.25 We all typically go to the shortest line in the grocery store. Data were collected on the num- ber of carts ahead in line and the total time to check out (minutes), including time in line, on five occasions. 4 6 68 Time to Check Out 5 11 9 14 16 11.43 Refer to Exercise 11.28. (a) What proportion of y variability is explained by the linear regression on x? (b) Find the sample correlation coefficient. (0) Calculate the least squares estimates Bo and B. Also estimate the error variance . (b) Test Ho: B0 versus Hy: B10 with = 05. (c) Estimate the expected y value corre- sponding to x 3 carts and give a 90% confidence interval. 11:26 Refer to Exercise 11.25. Construct a 90% confidence interval for the intercept Bo. Inter- pret. 11.27 Refer to Exercise 11.25. Obtain a 95% confi- dence interval for B. Interpret. 12.29 Recorded here are the scores xy and x2 in two midterm examinations, the GPA x3, and the final examination score y for 20 students in a statistics class 87 100 91 85 32 y 25 2.9 60 80 84 26 16 ww 3.3 52 3.5 60 3.7 56 76 2.8 33 65 Mebe 81 28 3.1 3.1 73 83 85 67 53 96 83 3.0 68 88 69 3.7 89 79 60 3.7 96 Brand A Brand B Color White Frequency 63 31 32 93 92 100 y 60 3.2 44 69 3.1 53 86 3.6 3.5 59 3.8 81 51 2.8 20 75 3.6 64 80 13.4 A market researcher wishes to assess consumers preference among three different colors available on name-brand dishwashers. The following fre- quencies were observed from a random sample of 150 recent sales 86 67 100 96 69 80 74 70 3.1 38 79 66 29 77 95 83 3.3 47 wwww 18 17 11 14 Stainless Black Total 56 31 150 Test the null hypothesis, at a= .05, that all three colors are equally popular. 13.13 Nausea from air sickness affects some travelers. In a comparative study of the effectiveness of two brands of motion sickness pills, brand A pills were given to 45 persons randomly selected from a group of 90 air travelers, while the other 45 persons were given brand B pills. The following results were obtained. Degree of Nausea None Slight Moderate Severe Total 45 45 Do these observations demonstrate that the two brands of pills are significantly different in quality? Testata 05. (a) Ignoring the data of GPA and the first midterm score, fit a simple linear regres- sion of y on x2. Computer. (b) Fit a multiple linear regression to predict the final examination score from the GPA and the scores in the midterms. Compute R. (c) Interpret the values of r2 and R obtained in parts (a) and (b). In part (b) use model for y on x2 and x3. (d) Fit multiple regression model of x3 on x1 and x2. (e) Calculate all multiple and partial correlation coefficients using x1, x2, and x3. 13.7 According to the records of the National Safety Council, accidental deaths in the United States during 2005 had the following distribution ac cording to the principal types of accidents Motor Vehicle Poison Falls Choking Drowning Other 40.5% 18.5 % 15.7 % 4.1% 3.2% 18.0% In a particular geographical region, the acciden- tal deaths, classified according to the principal types of accidents, yielded the following frequency distribution. Motor Vehicle Poison Falls Choking Drowning Other Total 356 207 125 33 26 161 908 Do these data show a significantly different distri- bution of accidental deaths as compared to that for the entire United States? Test at a 06. 13.11 Among a sample of 800 adult males, 414 said they usually open all of their mail. Among 900 adult females, 532 said they usually open all of their mail.3 (a) Construct a two-way table based on these frequencies (b) Formulate the null hypothesis (c) Conduct a test of your null hypothesis Use - 05. (d) Comment on the form of any departure from the null hypothesis per- 13.23 A survey was conducted by sampling 400 sons who were questioned regarding union membership and attitude toward decreased national spending on social welfare programs. The cross-tabulated frequency counts are presented. Support Indifferent Opposed Total 112 36 Union Nonunion 84 68 Total 196 104 28 72 100 Can these observed differences be explained by chance or are attitude and membership status associated? Mixing Technique 1 2 3 176 224 400 Temperature 100 125 150 175 3129 3200 2800 2600 13.26 Out of 120 members of a club who res ponded to a survey, 80 said that the golfing facilities were influential, 53 said the dining facilities were influential, and 25 said both were influential in their decision to join the club. Part 2 3-1. The tensile strength of portland cement is being studied. Four different mixing techniques can be used economically. The following data have been collected: 21.8 21.7 21.9 21.9 (a) Construct a two-way table of frequen- cies with two categories influential/not influential for each facility, golf and dining. (b) Formulate the null hypothesis. (c) Conduct a test of your null hypothe sis. Use a - 05. (d) Comment on the form of any departure from the null hypothesis Tensile Strength (lb/in) 3000 2865 3300 2975 2900 2700 21.9 21.4 21.8 21.7 (a) Test the hypothesis that mixing techniques affect the strength of the cement. Use a = 0.05. 2985 2600 3-4. An experiment was run to determine whether four specific firing temperatures affect the density of a certain type of brick. The experiment led to the following data: 2890 3150 3050 2765 Density 21.7 21.5 21.8 21.8 21.6 21.4 21.6 21.4 21.7 21.5 (a) Does the firing temperature affect the density of the bricks? Use a = 0.05. L 3-15. Four catalysts that may affect the concentration of one component in a three-component liquid mixture are being investigated. The following concentrations are obtained: 58.2 57.2 58.4 55.8 54.9 Chemical 1 2 3 2 56.3 54.5 57.0 55.3 Solution 1 2 3 (a) Do the four catalysts have the same effect on the concentration? 4-1. A chemist wishes to test the effect of four chemical agents on the strength of a particular type of cloth. Because there might be variability from one bolt to another, the chemist decides to use a randomized block design, with the bolts of cloth considered as blocks. She selects five bolts and applies all four chemicals in random order to each bolt. The resulting tensile strengths follow. Analyze the data from this experiment (use a = 0.05) and draw appropriate conclusions. Catalyst 1 2 73 68 73 67 75 68 73 71 1 13 16 5 3 50.1 54.2 55.4 2 22 24 4 4-2. Three different washing solutions are being compared to study their effectiveness in re- tarding bacteria growth in 5-gallon milk containers. The analysis is done in a laboratory, and only three trials can be run on any day. Because days could represent a potential source of variability, the experimenter decides to use a randomized block design. Obser- vations are taken for four days, and the data are shown here. Analyze the data from this experiment (use a = 0.05) and draw conclusions. Bolt 3 74 75 78 73 68 75 75 69 52.9 49.9 50.0 51.7 4 71 72 Days 3 18 17 1 5 67 70 39 44 22 4-14. The effect of five different ingredients (A, B, C, D, E) on the reaction time of a chemical process is being studied. Each batch of new material is only large enough to permit five runs to be made. Furthermore, each run requires approximately 1 hours, so only five runs can be made in one day. The experimenter decides to run the experiment as a Latin square so that day and batch effects may be systematically controlled. She obtains the data that follow. Analyze the data from this experiment (use a 0.05) and draw conclusions. Batch 1 1 A=8 C = 11 B = 4 D=6 E = 4 Order of Assembly 1 2 3 2 B=7 E=2 A=9 C=8 D=2 4 4-15. An industrial engineer is investigating the effect of four assembly methods (A, B, C, D) on the assembly time for a color television component. Four operators are selected for the study. Furthermore, the engineer knows that each assembly method produces such fatigue that the time required for the last assembly may be greater than the time required for the first, regardless of the method. That is, a trend develops in the required assembly time. To account for this source of variability, the engineer uses the Latin square design shown below. Analyze the data from this experiment (a= 0.05) and draw appropriate conclusions. 1 C-10 B=7 A=5 D=10 Day 3 D=1 A=7 C = 10 E=6 B-3 Operator 2 D=14 C = 18 B = 10 A-10 4 C=7 D = 3 E = 1 B=6 A = 8 3 A=7 D = 11 C = 11 B-12 5 E-3 B=8 D=5 A-10 C=8 B-8 A=8 D=9 C = 14 5-5. Johnson and Leone (Statistics and Experimental Design in Engineering and the Physical Sciences, Wiley, 1977) describe an experiment to investigate warping of copper plates. The two factors studied were the temperature and the copper content of the plates. The response variable was a measure of the amount of warping. The data were as follows: Temperature (C) 50 75 100 125 40 Drill Speed 125 17, 12, 9 16, 12 21, 17 20 200 Copper Content (%) 60 80 (a) Is there any indication that either factor affects the amount of warping? Is there any interaction between the factors? Use a = 0.05. 0.015 2.70 2.78 16, 21 18, 13 18, 21 23, 21 5-7. A mechanical engineer is studying the thrust force developed by a drill press. He suspects that the drilling speed and the feed rate of the material are the most important factors. He selects four feed rates and uses a high and low drill speed chosen to represent the extreme operating conditions. He obtains the following results. Analyze the data and draw con- clusions. Use a = 0.05. 2.83 2.86 Feed Rate 0.030 2.45 2.49 2.85 2.80 24, 22 17, 12 25, 23 23, 22 0.045 2.60 2.72 2.86 2.87 100 28, 27 27,31 30, 23 29, 31 0.060 2.75 2.86 2.94 2.88 5-8. An experiment is conducted to study the influence of operating temperature and three types of face-plate glass in the light output of an oscilloscope tube. The following data are collected: Glass Type Batch 1 1 25 30 26 100 580 568 570 Process 1 2 3 550 530 579 4 19 15 15 28 17 16 20 14 13 546 575 599 Temperature 125 1090 1087 1085 1070 1035 1000 (a) Use a = 0.05 in the analysis. Is there a significant interaction effect? Does glass type or temperature affect the response? What conclusions can you draw? 1 19 17 1045 1053 1066 13-1. A rocket propellant manufacturer is studying the burning rate of propellant from three production processes. Four batches of propellant are randomly selected from the output of each process and three determinations of burning rate are made on each batch. The results follow. Analyze the data and draw conclusions. Process 2 2 3 23 24 14 21 18 21 17 4 150 1392 1380 1386 1328 1312 1299 322 867 904 889 27 1 35 14 15 25 20 Process 3 2 35 21 24 3 4 38 25 54 29 50 33 13-2. The surface finish of metal parts made on four machines is being studied. An experiment is conducted in which each machine is run by three different operators and two specimens from each operator are collected and tested. Because of the location of the machines, different operators are used on each machine, and the operators are chosen at random. The data are shown in the following table. Analyze the data and draw conclusions. Operator Machine 1 1 2 3 79 62 94 46 74 57 Machine 2 1 92 99 2 3 85 76 79 68 Machine 3 1 2 3 188 75 Machine 4 1 2 3 53 46 36 56 57 53 75 40 56 62 47
Step by Step Solution
3.34 Rating (157 Votes )
There are 3 Steps involved in it
Sum SSxx SSYY X 10 1 2 3 4 10 Based on the above table the ... View full answer

Get step-by-step solutions from verified subject matter experts