

Question: Q 2 : Plot the response of a second - order system with = 0 . 1 and n = 0 . 5 r a
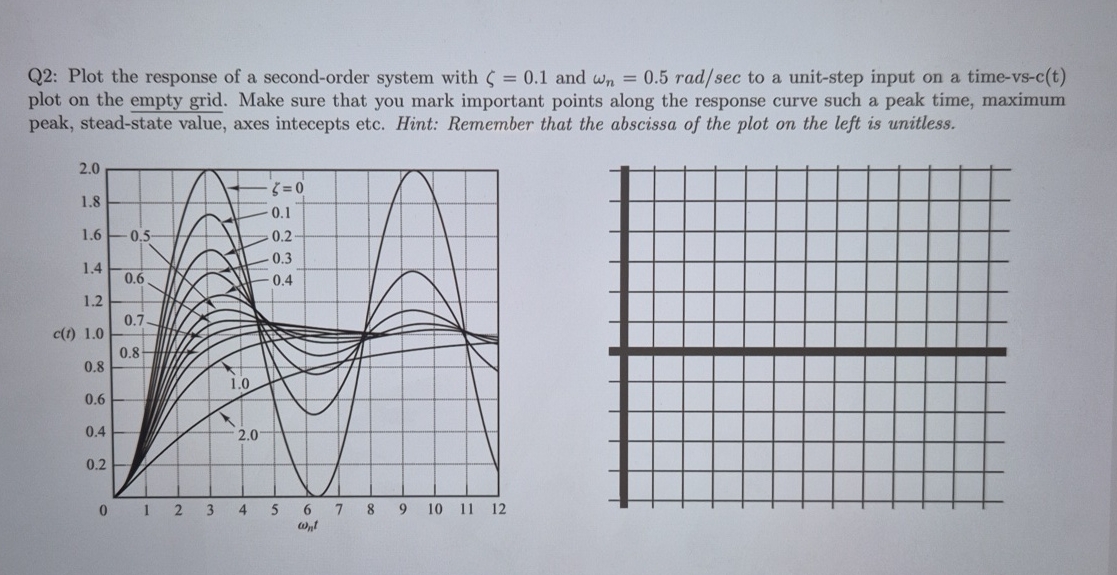
Q: Plot the response of a secondorder system with and to a unitstep input on a timevsct plot on the empty grid. Make sure that you mark important points along the response curve such a peak time, maximum peak, steadstate value, axes intecepts etc. Hint: Remember that the abscissa of the plot on the left is unitless.
please show i can to fill the empty grid with needed values
Step by Step Solution
There are 3 Steps involved in it
1 Expert Approved Answer
Step: 1 Unlock

Question Has Been Solved by an Expert!
Get step-by-step solutions from verified subject matter experts
Step: 2 Unlock
Step: 3 Unlock