

Question: Q 2 . Read the file marketing _ campaign.csv . The dataset records 1 5 6 0 customers' different information, each row represents one customer.
Q Read the file marketingcampaign.csv The dataset records customers' different information, each row
represents one customer. The variable names are selfexplanatory. Answer the following questions.
Please answer the questions below with Python, display the codes, result and graphs clearly.
a points What are the unique values in the variable MaritalStatus?
b points How many Single and Married customers are there in this data set?
c points Show the mean Income of Single and Married customers. Which group has a higher mean
Income?
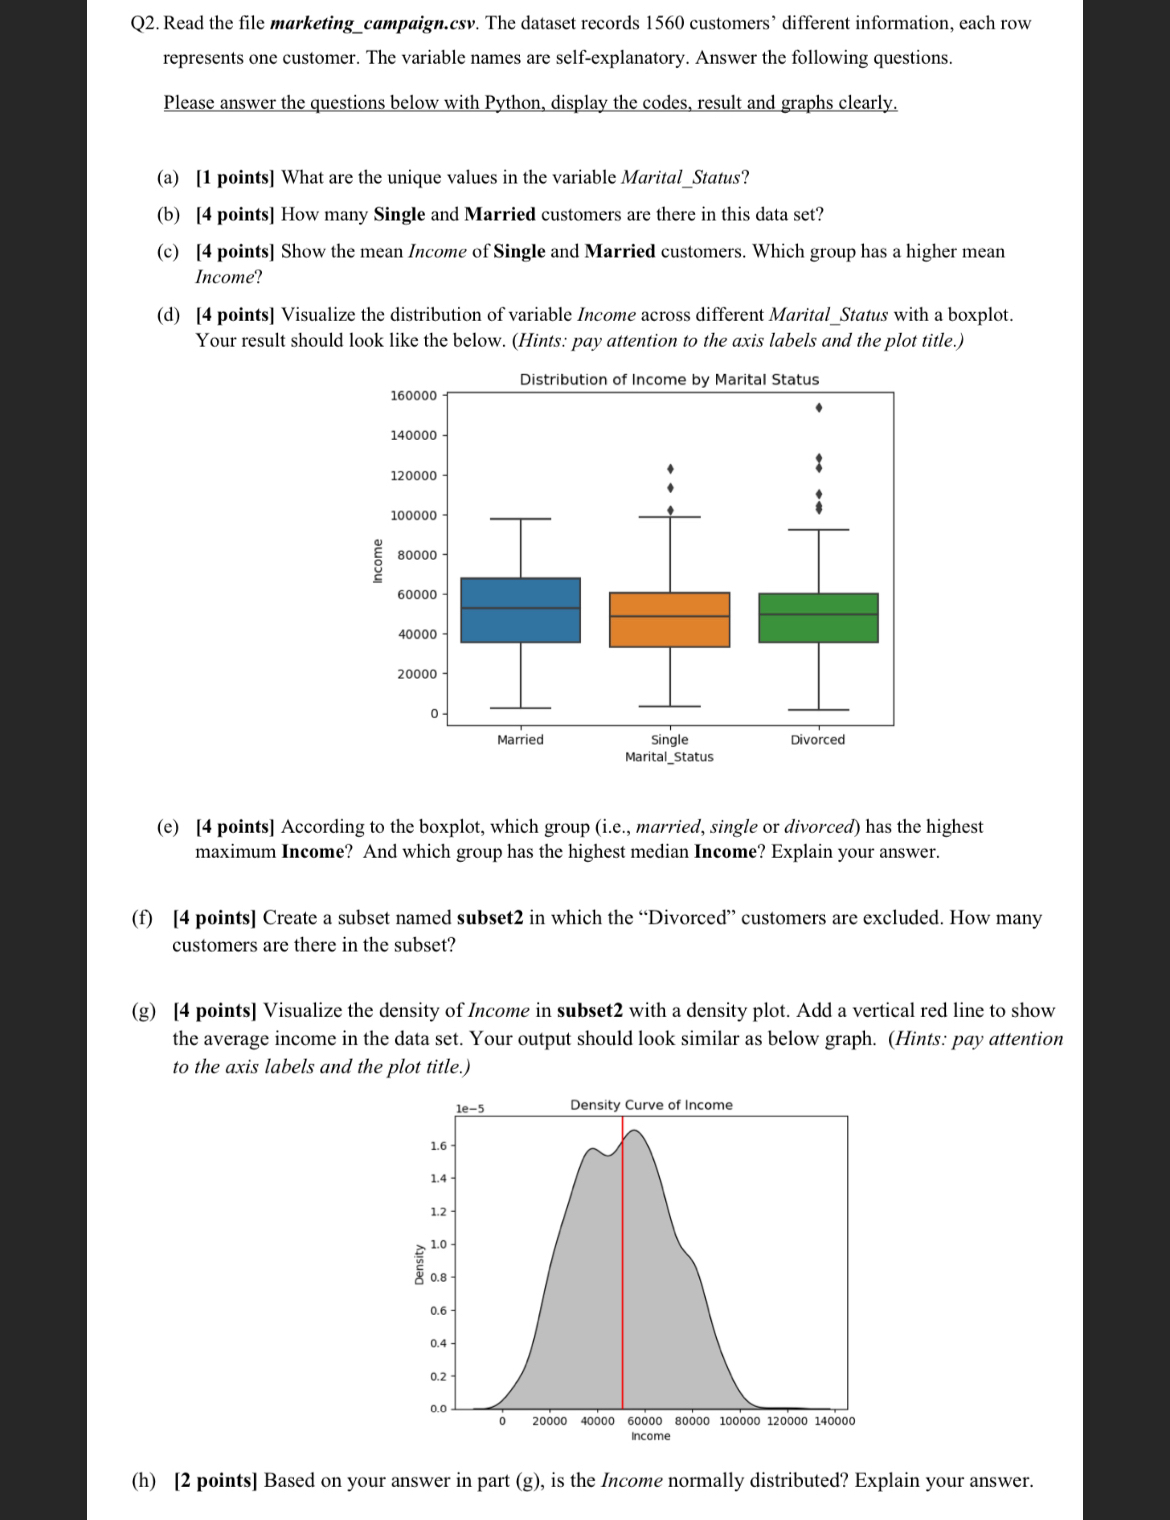
d points Visualize the distribution of variable Income across different MaritalStatus with a boxplot.
Your result should look like the below. Hints: pay attention to the axis labels and the plot title.
e points According to the boxplot, which group ie married, single or divorced has the highest
maximum Income? And which group has the highest median Income? Explain your answer.
f points Create a subset named subset in which the "Divorced" customers are excluded. How many
customers are there in the subset?
g points Visualize the density of Income in subset with a density plot. Add a vertical red line to show
the average income in the data set. Your output should look similar as below graph. Hints: pay attention
to the axis labels and the plot title.
h points Based on your answer in part g is the Income normally distributed? Explain your answer.
Step by Step Solution
There are 3 Steps involved in it
1 Expert Approved Answer
Step: 1 Unlock

Question Has Been Solved by an Expert!
Get step-by-step solutions from verified subject matter experts
Step: 2 Unlock
Step: 3 Unlock