

Question: Q 2 . The jobs are first processed on server 1 with an exponential rate of 1 and then on server 2 with an exponential
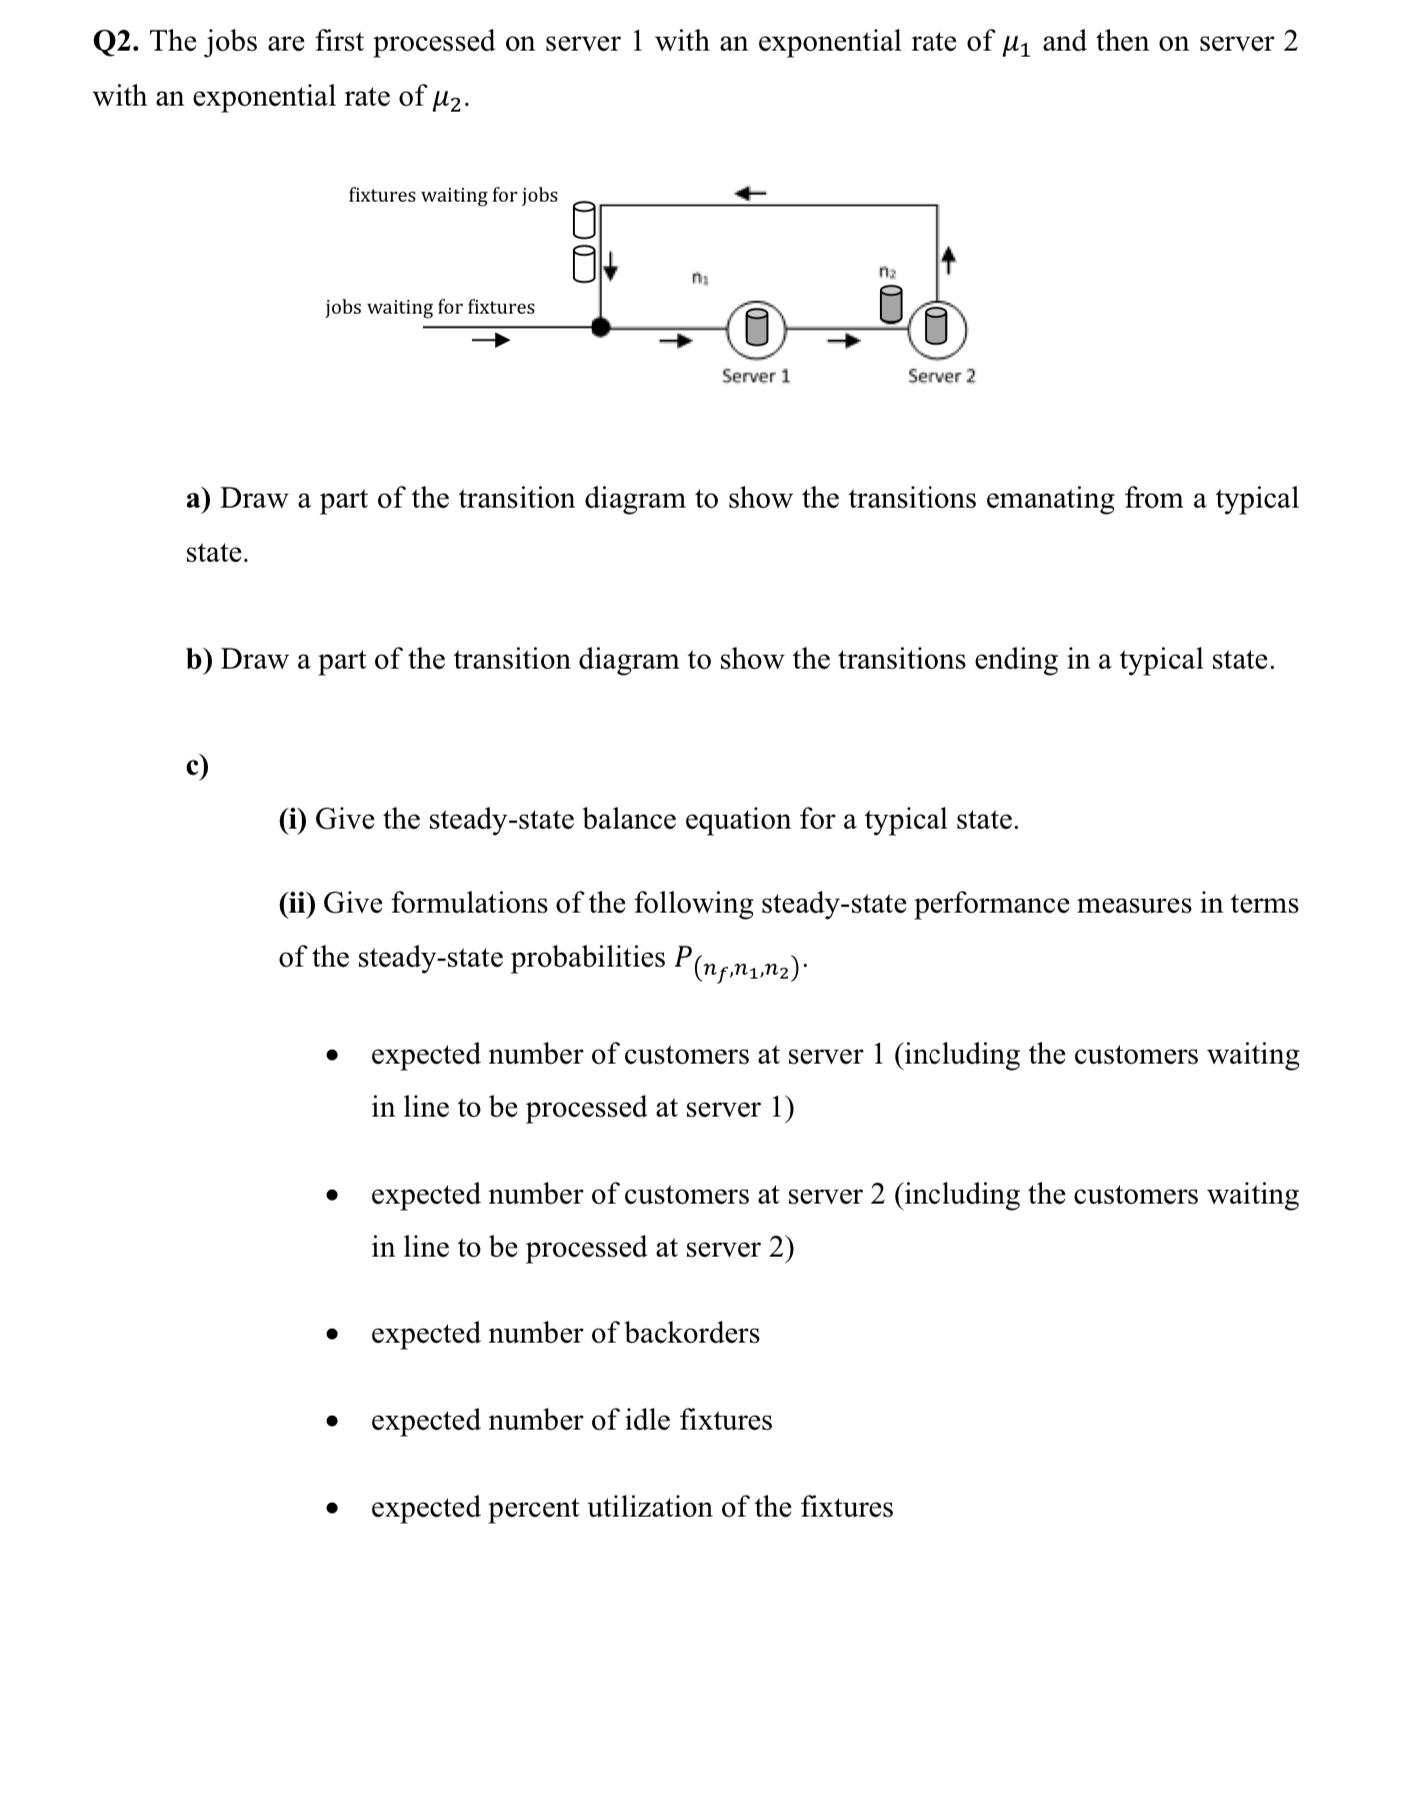
Q The jobs are first processed on server with an exponential rate of and then on server with an exponential rate of
a Draw a part of the transition diagram to show the transitions emanating from a typical state.
b Draw a part of the transition diagram to show the transitions ending in a typical state.
c
i Give the steadystate balance equation for a typical state.
ii Give formulations of the following steadystate performance measures in terms of the steadystate probabilities
expected number of customers at server including the customers waiting in line to be processed at server
expected number of customers at server including the customers waiting in line to be processed at server
expected number of backorders
expected number of idle fixtures
expected percent utilization of the fixtures
Step by Step Solution
There are 3 Steps involved in it
1 Expert Approved Answer
Step: 1 Unlock

Question Has Been Solved by an Expert!
Get step-by-step solutions from verified subject matter experts
Step: 2 Unlock
Step: 3 Unlock