

Question: q 20 Data Table w Beyond Leaming Inc. has two divisions: Test Preparation and Language Arts. Results (in millions) for the past (Click the icon

q 20
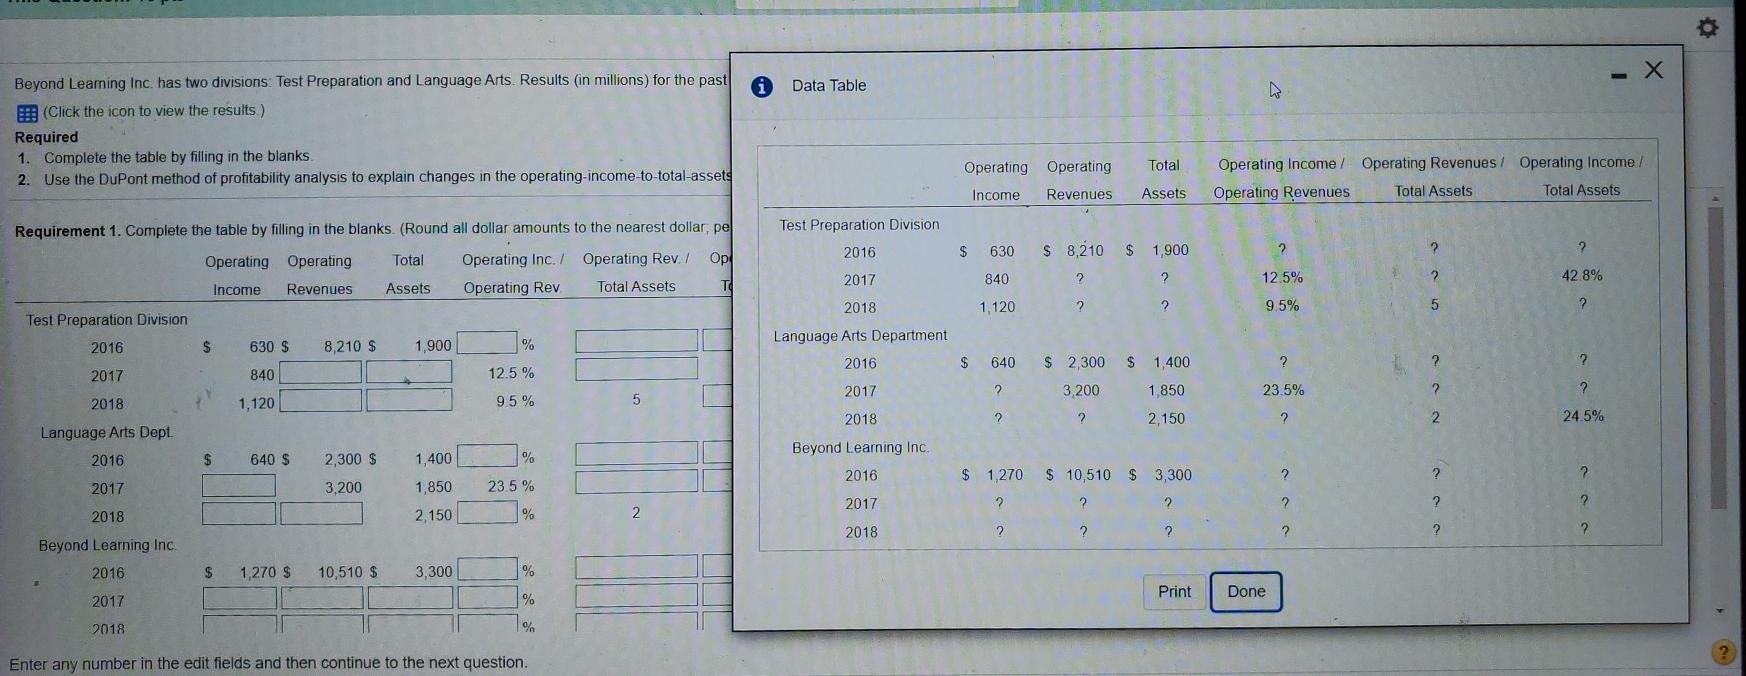
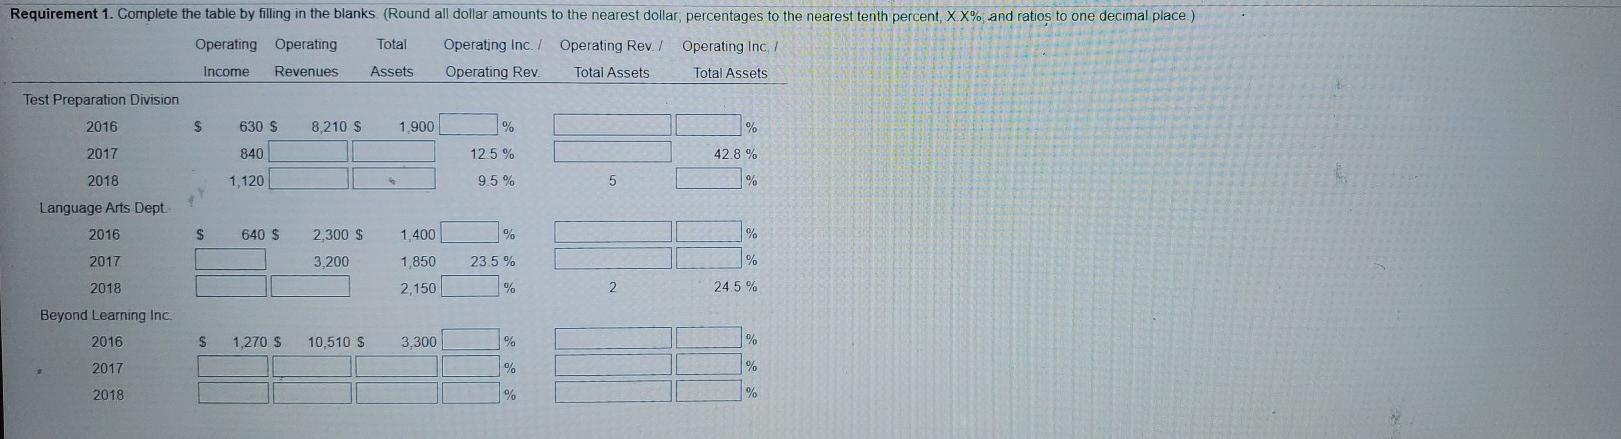
Data Table w Beyond Leaming Inc. has two divisions: Test Preparation and Language Arts. Results (in millions) for the past (Click the icon to view the results.) Required 1. Complete the table by filling in the blanks 2. Use the DuPont method of profitability analysis to explain changes in the operating-income-to-total-assets Total Operating Operating Income Revenues Operating Income/ Operating Revenues / Operating Income! Operating Revenues Total Assets Total Assets Assets Requirement 1. Complete the table by filling in the blanks (Round all dollar amounts to the nearest dollar, pe Test Preparation Division $ 2016 630 S 8,210 $ 1,900 2 2 ? Total Op Operating Operating Income Revenues Operating Inc./ Operating Rev. Operating Rev Total Assets 840 2017 2 ? 12.5% 2 42.8% Assets TO 2018 1,120 ? 2 9.5% 5 ? Test Preparation Division 2016 Language Arts Department $ 630 $ 8,210 $ 1,900 % 2016 $ 640 $ 2,300 $ 1,400 ? 2 ? 2017 840 12.5% 2017 ? 3,200 1 850 23.5% 2 2 2018 1,120 9.5% 2018 ? 2 2,150 ? 2. 24 5% Language Arts Dept. 2016 $ 640 $ 1,400 % 2,300 $ 3,200 Beyond Learning Inc. 2016 $ 1270 $ 10,510 $ 3,300 2 ? 2 2017 1,850 23.5 % 2017 2 2 2 2 ? 2018 2,150 % 2 2018 2 ? ? ? ? 2 Beyond Learning Inc. 2016 $ 1,270 $ 10,510 $ 3,300 % Print Done 2017 % 2018 % Enter any number in the edit fields and then continue to the next question. % Requirement 1. Complete the table by filling in the blanks (Round all dollar amounts to the nearest dollar, percentages to the nearest tenth percent, XX% and ratios to one decimal place.) Operating Operating Total Operating Inc. / Operating Rev. / Operating Inc, / Income Revenues Assets Operating Rev. Total Assets Total Assets Test Preparation Division 2016 S 630 S 8,210 $ 1.900 % 2017 840 12.5 % 42.8% 2018 1,120 9.5% 5 % Language Arts Dept. 2016 $ 640 $ 2.300 S 1.400 % 2017 3,200 1,850 23.5 % % 2,150 % 2 24.5 % % 2018 Beyond Learning Inc. 2016 $ 1,270 $ 10,510 $ 3,300 % % 2017 % % 2018 % % Requirement 2. Use the DuPont method of profitability analysis to explain changes in the operating-income-to-total-assets ratios over the 2016 through 2018 period for each division and for Beyond Learning as a whole. Comment on the results Based on revenues, V The Vearns higher profit margins. The turns over its assets at about twice the rate as the other division The ROI of the V has been increasing from 2016 to 2018 and the ROI of the has been decreasing Overall, this has resulted in Beyond Learning showing a(n) ROI over the past three years *
Step by Step Solution
There are 3 Steps involved in it

Get step-by-step solutions from verified subject matter experts