

Question: Beyond Learning, Inc. has two divisions: Test Preparation and Language Arts. Results (in millions) for the past 3 years are partially displayed here: (Click the
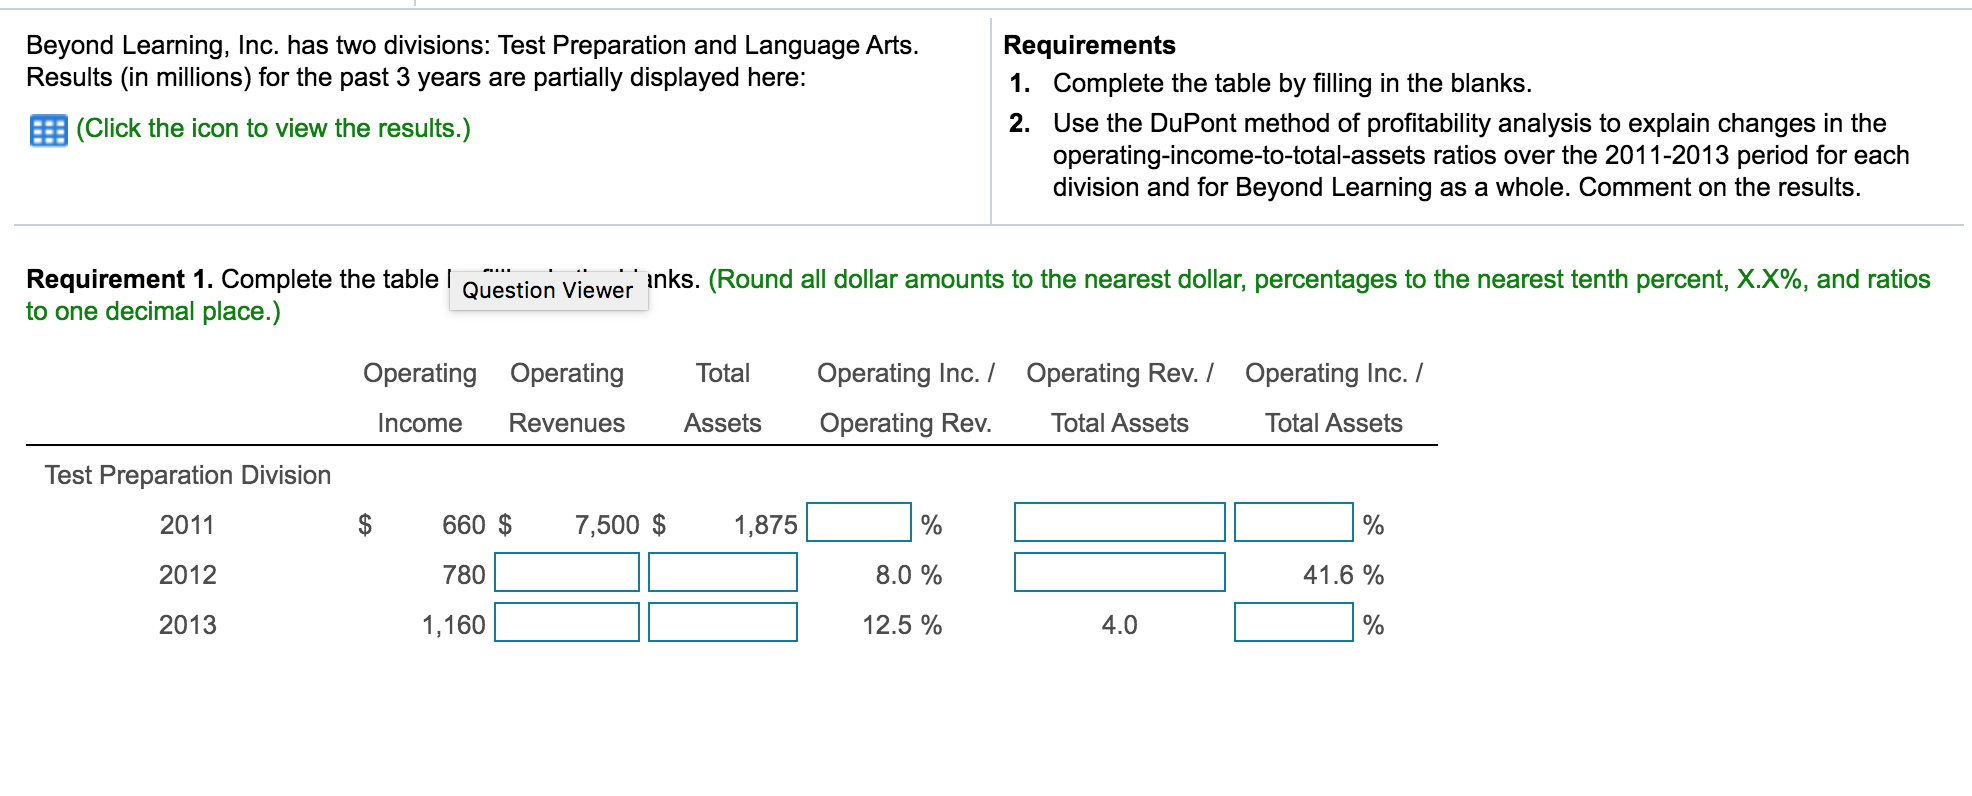
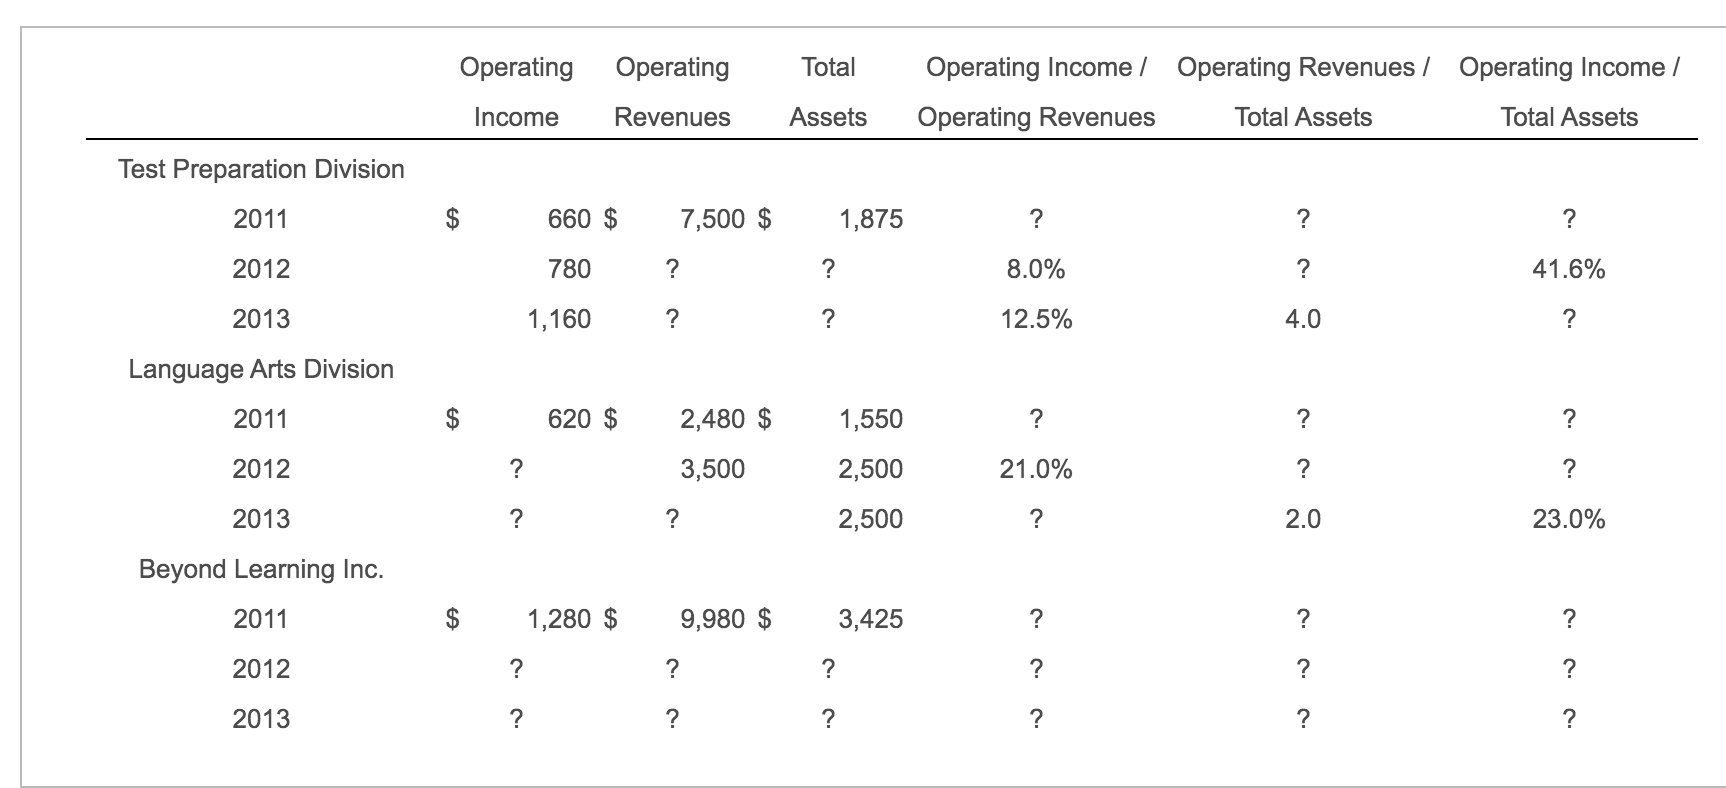
Beyond Learning, Inc. has two divisions: Test Preparation and Language Arts. Results (in millions) for the past 3 years are partially displayed here: (Click the icon to view the results.) Requirements 1. Complete the table by filling in the blanks. 2. Use the DuPont method of profitability analysis to explain changes in the operating-income-to-total-assets ratios over the 2011-2013 period for each division and for Beyond Learning as a whole. Comment on the results. Requirement 1. Complete the table ! Question Viewer inks. (Round all dollar amounts to the nearest dollar, percentages to the nearest tenth percent, X.X%, and ratios to one decimal place.) Operating Income Operating Revenues Total Assets Operating Inc. / Operating Rev. / Operating Inc. / Operating Rev. Total Assets Total Assets Test Preparation Division 2011 $ 660 $ 7,500 $ 1,875 % 1 2012 780 8.0 % % 41.6 % % 2013 1,160 12.5 % 4.0 D Operating Income Operating Revenues Total Assets Operating Income / Operating Revenues / Operating Income / Operating Revenues Total Assets Total Assets Test Preparation Division 2011 $ ? ? 2012 660 $ 780 1,160 7,500 $ ? ? 1,875 ? ? 8.0% 41.6% 12.5% 2013 Language Arts Division 2011 $ 620 $ 2,480 $ 3,500 1,550 2,500 2012 21.0% 2013 2,500 23.0% Beyond Learning Inc. 2011 $ 1,280 $ 9,980 $ 3,425 2012 2013 Beyond Learning, Inc. has two divisions: Test Preparation and Language Arts. Results (in millions) for the past 3 years are partially displayed here: (Click the icon to view the results.) Requirements 1. Complete the table by filling in the blanks. 2. Use the DuPont method of profitability analysis to explain changes in the operating-income-to-total-assets ratios over the 2011-2013 period for each division and for Beyond Learning as a whole. Comment on the results. Requirement 1. Complete the table ! Question Viewer inks. (Round all dollar amounts to the nearest dollar, percentages to the nearest tenth percent, X.X%, and ratios to one decimal place.) Operating Income Operating Revenues Total Assets Operating Inc. / Operating Rev. / Operating Inc. / Operating Rev. Total Assets Total Assets Test Preparation Division 2011 $ 660 $ 7,500 $ 1,875 % 1 2012 780 8.0 % % 41.6 % % 2013 1,160 12.5 % 4.0 D Operating Income Operating Revenues Total Assets Operating Income / Operating Revenues / Operating Income / Operating Revenues Total Assets Total Assets Test Preparation Division 2011 $ ? ? 2012 660 $ 780 1,160 7,500 $ ? ? 1,875 ? ? 8.0% 41.6% 12.5% 2013 Language Arts Division 2011 $ 620 $ 2,480 $ 3,500 1,550 2,500 2012 21.0% 2013 2,500 23.0% Beyond Learning Inc. 2011 $ 1,280 $ 9,980 $ 3,425 2012 2013
Step by Step Solution
There are 3 Steps involved in it

Get step-by-step solutions from verified subject matter experts