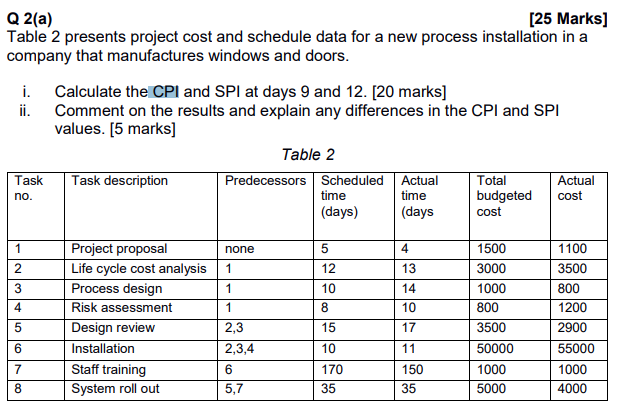
Question: Q 2(a) [25 Marks) Table 2 presents project cost and schedule data for a new process installation in a company that manufactures windows and doors.

Q 2(a) [25 Marks) Table 2 presents project cost

Q 2(a) [25 Marks) Table 2 presents project cost and schedule data for a new process installation in a company that manufactures windows and doors. i. Calculate the CPI and SPI at days 9 and 12. [20 marks] ii. Comment on the results and explain any differences in the CPI and SPI values. [5 marks) Table 2 Task Task description Predecessors Scheduled Actual Total Actual time time budgeted (days) (days no. cost cost 1 none 5 4 1100 1500 3000 2 1 12 13 3500 3 1 10 14 1000 800 4 1 8 10 00 volol AWN Project proposal Life cycle cost analysis Process design Risk assessment Design review Installation Staff training System roll out 800 1200 2900 5 15 17 6 10 11 55000 2,3 2,3,4 6 5,7 3500 50000 1000 5000 7 150 1000 170 35 8 35 4000

Step by Step Solution

There are 3 Steps involved in it

1 Expert Approved Answer
Step: 1 Unlock blur-text-image
Question Has Been Solved by an Expert!

Get step-by-step solutions from verified subject matter experts

Step: 2 Unlock
Step: 3 Unlock

Students Have Also Explored These Related General Management Questions!