

Question: Q 3 ( 1 4 pts ) : Charts above. Note: UVC = unit variable cost. The horizontal axis represents customer segments of varying sizes.
Q pts:
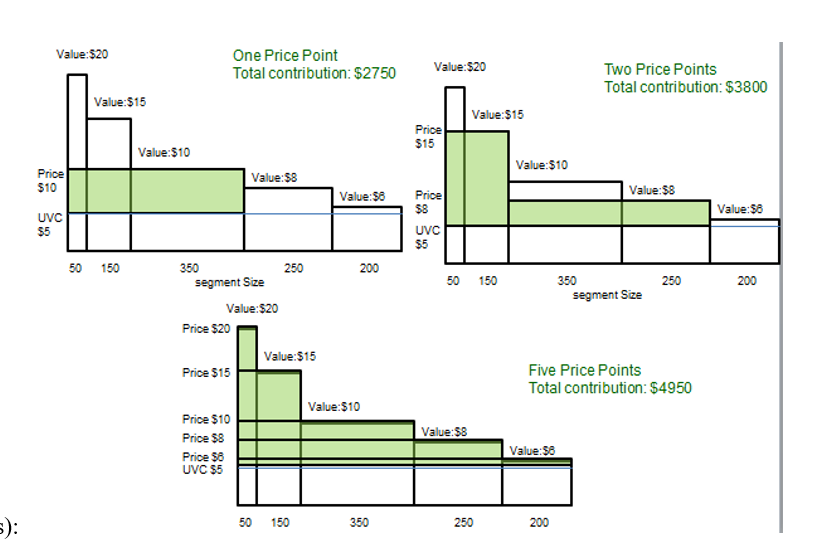
Charts above. Note: UVC unit variable cost. The horizontal axis represents customer segments of varying sizes. The maximum perceived values are shown below.
A Why is $ the optimal price to maximize total contribution if a single price point is used? Show through calculations pts Hint: calculate the total contribution at each of the five prices and then compare.
B Show through calculations how you get $ as the total contribution in the nd scenario pts
C Suppose I use a different prices structure, ie I advertise $ to the first two segments and $ to the other three segments. What is the total amount of contribution that I can earn? Show calculations. pts
Step by Step Solution
There are 3 Steps involved in it
1 Expert Approved Answer
Step: 1 Unlock

Question Has Been Solved by an Expert!
Get step-by-step solutions from verified subject matter experts
Step: 2 Unlock
Step: 3 Unlock