

Question: Q . 3 ( a ) The results below were obtained in a Standard Proctor compaction test on a soil sample with a specific gravity
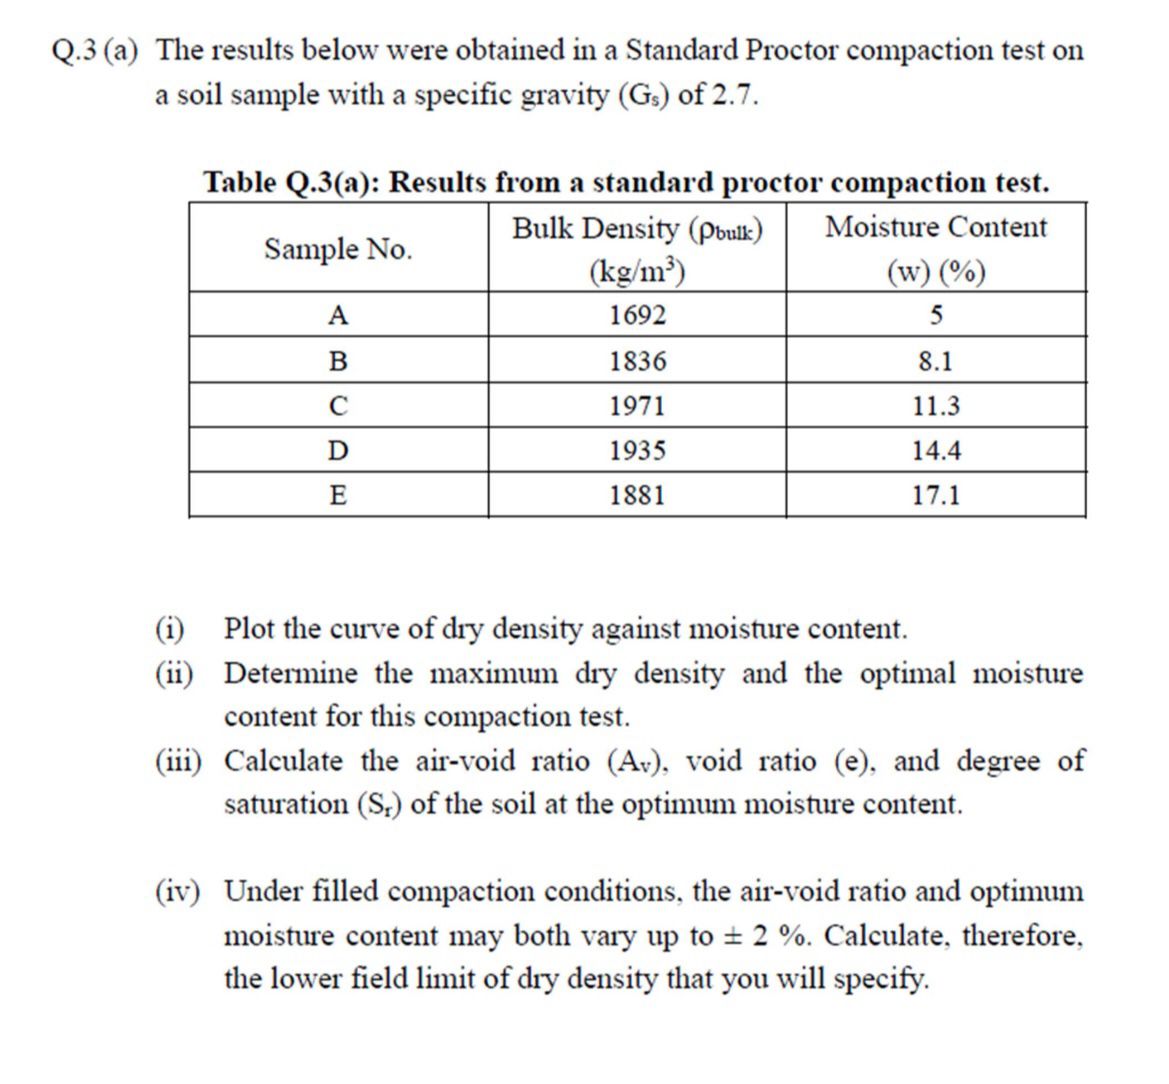
Qa The results below were obtained in a Standard Proctor compaction test on
a soil sample with a specific gravity of
Table Qa: Results from a standard proctor compaction test.
i Plot the curve of dry density against moisture content.
ii Determine the maximum dry density and the optimal moisture
content for this compaction test.
iii Calculate the airvoid ratio void ratio e and degree of
saturation of the soil at the optimum moisture content.
iv Under filled compaction conditions, the airvoid ratio and optimum
moisture content may both vary up to Calculate, therefore,
the lower field limit of dry density that you will specify.
Step by Step Solution
There are 3 Steps involved in it
1 Expert Approved Answer
Step: 1 Unlock

Question Has Been Solved by an Expert!
Get step-by-step solutions from verified subject matter experts
Step: 2 Unlock
Step: 3 Unlock