

Question: Q 3 . Use the monthly return data for IBM, BAC, and MSFT , and the risk - free asset s return of 3 %
Q Use the monthly return data for IBM, BAC, and MSFT and the riskfree assets return of to do the following:
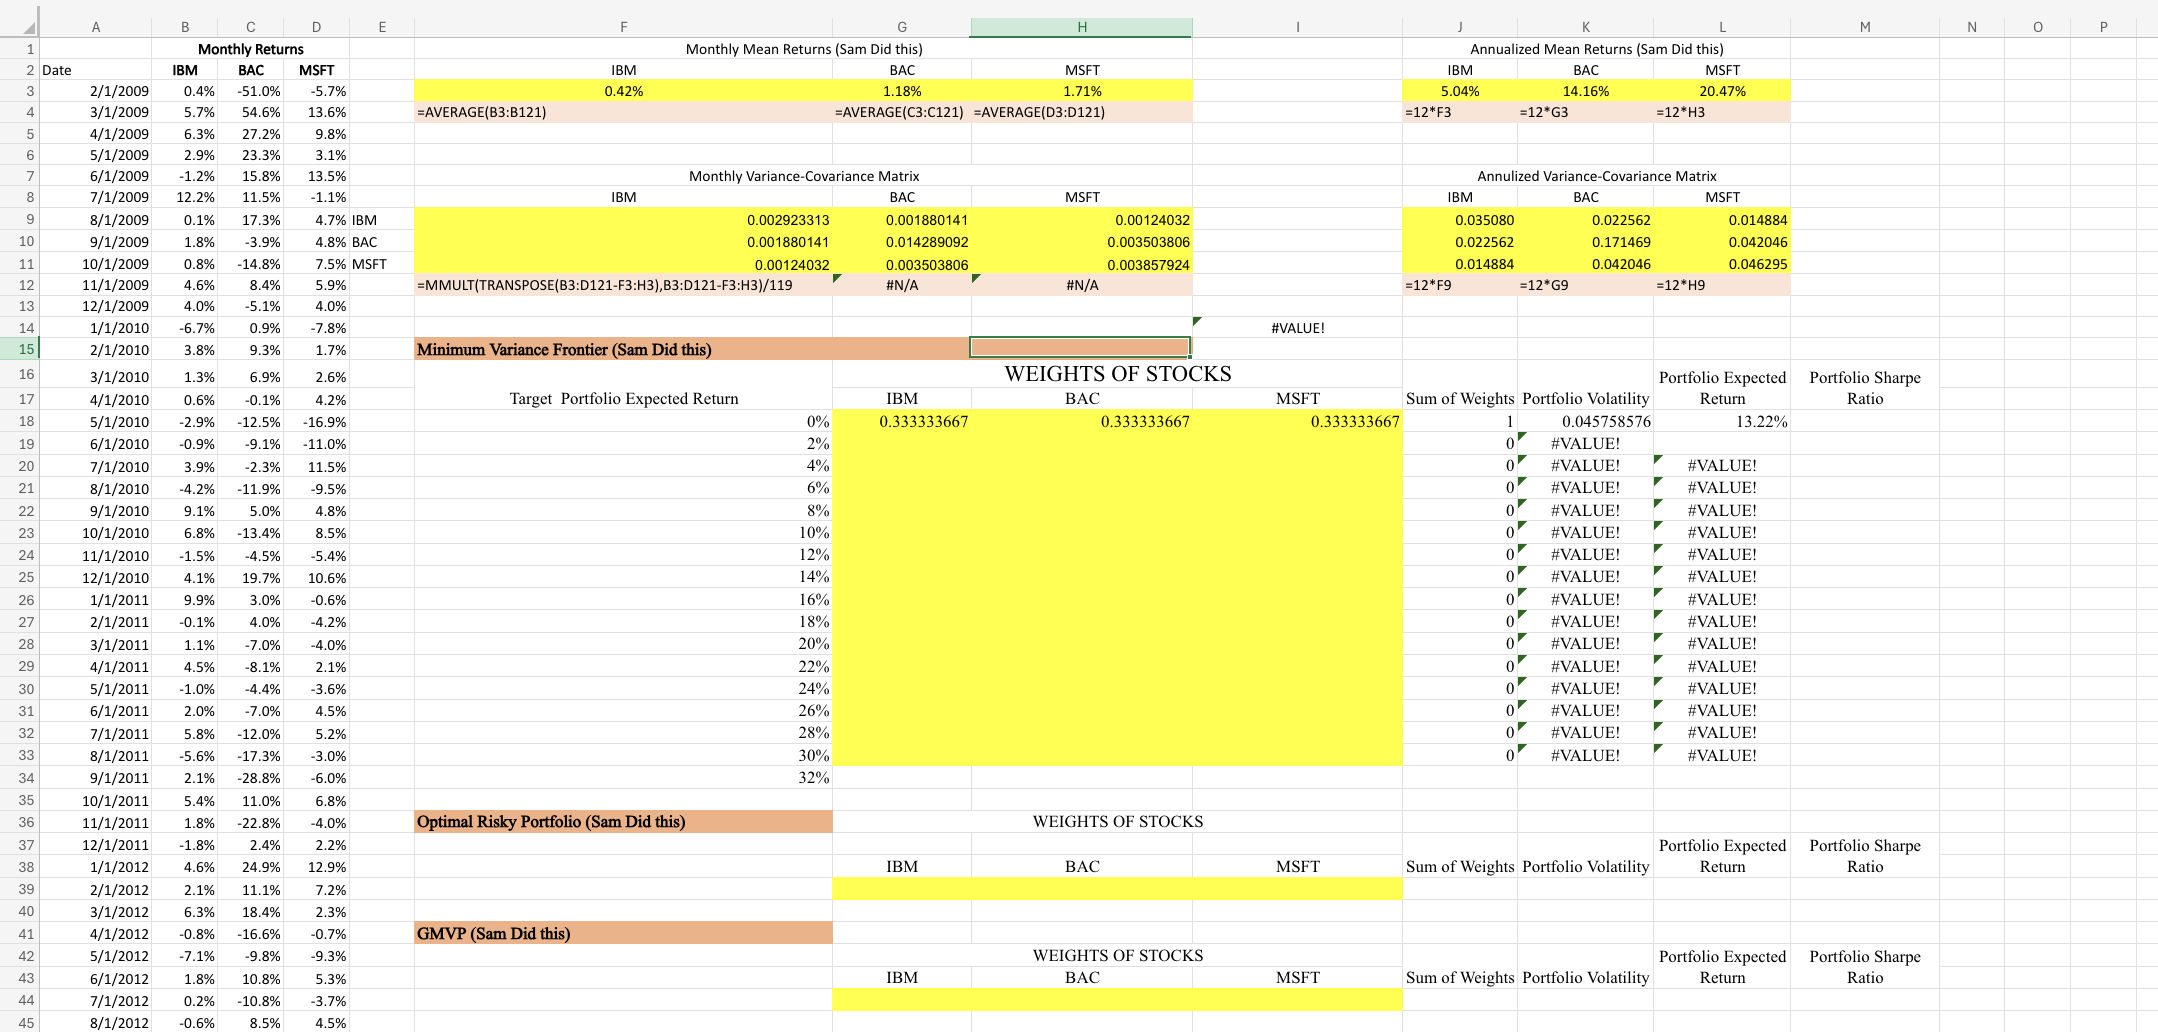
Find the portfolio weights of the three assets with minimum variance for a series of given target expected returns. point
Find the optimal risky portfolio. point
Find the Global MinimumVariance Portfolio GMVP point
We want to form new portfolios using riskfree asset and optimal risky portfolio. What are the annual expected return, standard deviation and Sharpe ratio of the new portfolios with different weights of the riskfree asset and the optimal risky portfolio? points
All the portfolios in part lie on capital allocation line CAL Make a smooth marked scatter plot with the minimumvariance frontier, optimal risky portfolio, GMVP and the capital allocation line on the same graph, including legends. point
Step by Step Solution
There are 3 Steps involved in it
1 Expert Approved Answer
Step: 1 Unlock

Question Has Been Solved by an Expert!
Get step-by-step solutions from verified subject matter experts
Step: 2 Unlock
Step: 3 Unlock