

Question: What would be the capital allocation between the risk free asset and the optimal risky investment portfolio for an individual with risk aversion coefficient of
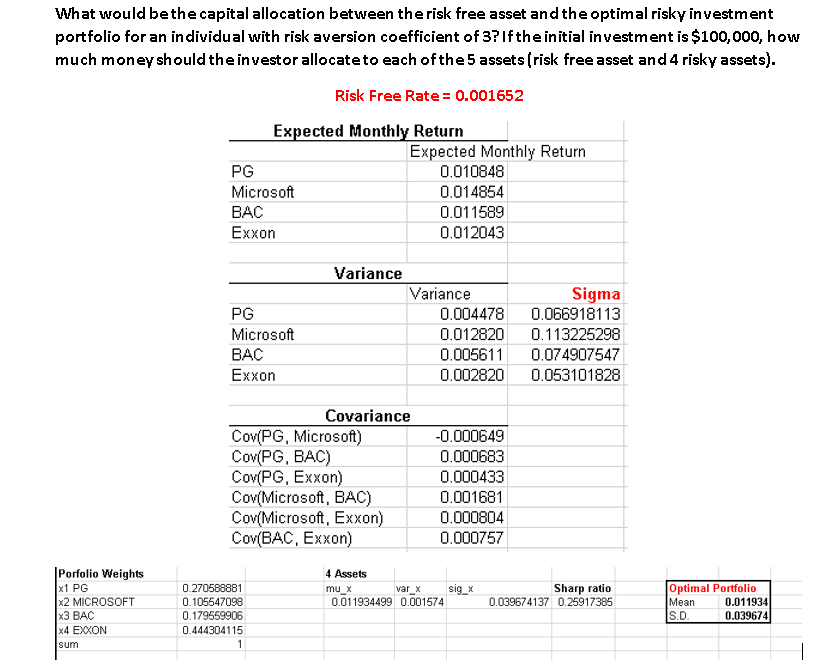
What would be the capital allocation between the risk free asset and the optimal risky investment portfolio for an individual with risk aversion coefficient of 3? If the initial investment is $100,000, how much money should the investor allocate to each of the 5 assets (risk free asset and 4 risky assets). Risk Free Rate = 0.001652 Expected Monthly Return Expected Monthly Return PG 0.010848 Microsoft 0.014854 BAC 0.011589 Exxon 0.012043 PG Microsoft BAC Exxon Variance Variance 0.004478 0.012820 0.005611 0.002820 Sigma 0.066918113 0.113225298 0.074907547 0.053101828 Covariance Cov(PG, Microsoft Cov(PG, BAC) Cov(PG, Exxon) Cov(Microsoft, BAC) Cov(Microsoft, Exxon) Cov(BAC, Exxon) -0.000649 0.000683 0.000433 0.001681 0.000804 0.000757 Porfolio Weights x1 PG x2 MICROSOFT x3 *4 EXXON sum Sig_X 0.270588881 0.105547098 0.179559906 0.444304115 4 Assets mu var X 0.011934499 0.001574 Sharp ratio 0.039674137 0.25917385 Optimal Portfolio Mean 0.011934 S.D. 0.039674 What would be the capital allocation between the risk free asset and the optimal risky investment portfolio for an individual with risk aversion coefficient of 3? If the initial investment is $100,000, how much money should the investor allocate to each of the 5 assets (risk free asset and 4 risky assets). Risk Free Rate = 0.001652 Expected Monthly Return Expected Monthly Return PG 0.010848 Microsoft 0.014854 BAC 0.011589 Exxon 0.012043 PG Microsoft BAC Exxon Variance Variance 0.004478 0.012820 0.005611 0.002820 Sigma 0.066918113 0.113225298 0.074907547 0.053101828 Covariance Cov(PG, Microsoft Cov(PG, BAC) Cov(PG, Exxon) Cov(Microsoft, BAC) Cov(Microsoft, Exxon) Cov(BAC, Exxon) -0.000649 0.000683 0.000433 0.001681 0.000804 0.000757 Porfolio Weights x1 PG x2 MICROSOFT x3 *4 EXXON sum Sig_X 0.270588881 0.105547098 0.179559906 0.444304115 4 Assets mu var X 0.011934499 0.001574 Sharp ratio 0.039674137 0.25917385 Optimal Portfolio Mean 0.011934 S.D. 0.039674
Step by Step Solution
There are 3 Steps involved in it

Get step-by-step solutions from verified subject matter experts