

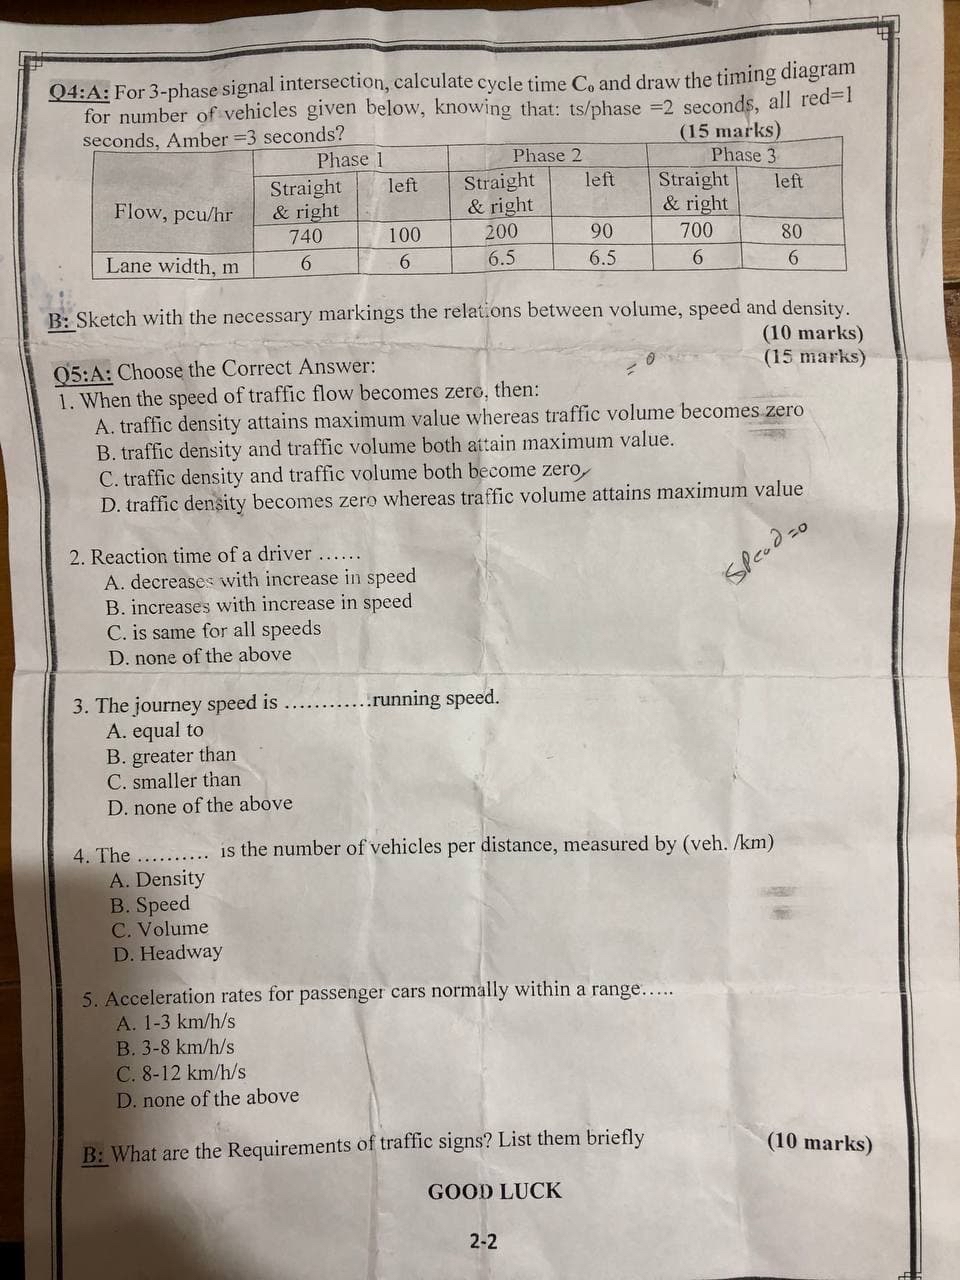
Question: Q 4 : A: For 3 - phase signal intersection, calculate cycle time C 0 and draw the timing diagram for number of vehicles given
Q: A: For phase signal intersection, calculate cycle time and draw the timing diagram for number of vehicles given below, knowing that: phase seconds, all red seconds, Amber seconds?
marks
tableFlow pcuhrPhase Phase tableStraight& rightleft,tableStraight& rightleft,tableStraight& rightleftLane width, m
B: Sketch with the necessary markings the relations between volume, speed and density.
marks
marks
Q:A: Choose the Correct Answer:
When the speed of traffic flow becomes zero, then:
A traffic density attains maximum value whereas traffic volume becomes zero
B traffic density and traffic volume both attain maximum value.
C traffic density and traffic volume both become zero,
D traffic density becomes zero whereas traffic volume attains maximum value
Reaction time of a driver
A decreases with increase in speed
B increases with increase in speed
C is same for all speeds
D none of the above
The journey speed is running speed.
A equal to
B greater than
C smaller than
D none of the above
The is the number of vehicles per distance, measured by veh
A Density
B Speed
C Volume
D Headway
Acceleration rates for passenger cars normally within a range.....
A
B
C
D none of the above
B: What are the Requirements of traffic signs? List them briefly
marks
GOOD LUCK
Step by Step Solution
There are 3 Steps involved in it
1 Expert Approved Answer
Step: 1 Unlock

Question Has Been Solved by an Expert!
Get step-by-step solutions from verified subject matter experts
Step: 2 Unlock
Step: 3 Unlock