

Question: Task 3: Analysis of shock wave A four-legged intersection, as shown in Figure 4, operates under a fixed time signal system. The phase diagram (Figure
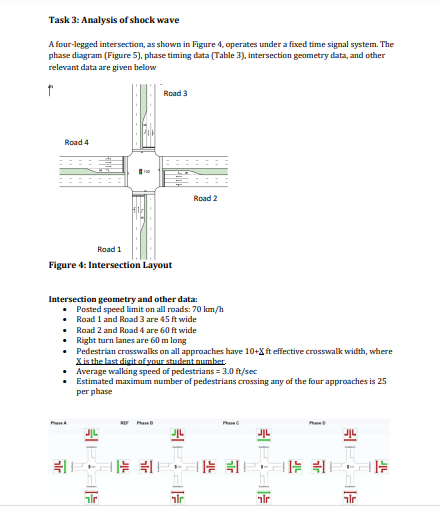
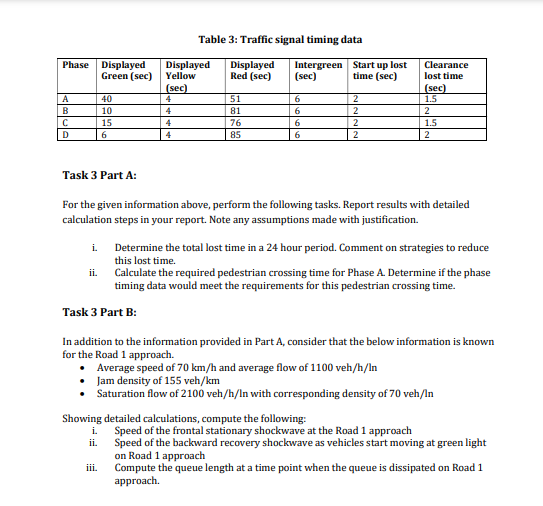
Task 3: Analysis of shock wave A four-legged intersection, as shown in Figure 4, operates under a fixed time signal system. The phase diagram (Figure 5). phase timing data Table 3), intersection geometry data, and other relevant data are given below f Road 3 Road 4 Road 2 Road 1 Figure 1: Intersection Layout Intersection geometry and other data: Posted speed limit on all roads: 70 km/h Road 1 and Road 3 are 45 ft wide Road 2 and Road 4 are 60ft wide Right turn lanes are 60 m long Pedestrian crosswalks on all approaches have 10+Xft effective crosswalk width, where X is the last digit of your student number Average walking speed of pedestrians = 3.0 ft/sec Estimated maximum number of pedestrians crossing any of the four approaches is 25 per phase Paseo he JIL JL I IS 31 I -11 alr hr Phase Displayed Green (sec) Table 3: Traffic signal timing data Displayed Displayed Intergreen Start up lost Yellow Red (sec) (sec) time (sec) (sec) 4 51 2 4 81 6 2 4 76 6 2 4 85 6 2 6 A B C D 40 10 15 6 Clearance lost time (sec) 1.5 2 1.5 2 Task 3 Part A: For the given information above, perform the following tasks. Report results with detailed calculation steps in your report. Note any assumptions made with justification. i. Determine the total lost time in a 24 hour period. Comment on strategies to reduce this lost time. ii. Calculate the required pedestrian crossing time for Phase A. Determine if the phase timing data would meet the requirements for this pedestrian crossing time. Task 3 Part B: In addition to the information provided in Part A, consider that the below information is known for the Road 1 approach. Average speed of 70 km/h and average flow of 1100 veh/h/In Jam density of 155 veh/km Saturation flow of 2100 veh/h/In with corresponding density of 70 veh/In Showing detailed calculations, compute the following: Speed of the frontal stationary shockwave at the Road 1 approach Speed of the backward recovery shockwave as vehicles start moving at green light on Road 1 approach Compute the queue length at a time point when the queue is dissipated on Road 1 approach i. ii. iii. Task 3: Analysis of shock wave A four-legged intersection, as shown in Figure 4, operates under a fixed time signal system. The phase diagram (Figure 5). phase timing data Table 3), intersection geometry data, and other relevant data are given below f Road 3 Road 4 Road 2 Road 1 Figure 1: Intersection Layout Intersection geometry and other data: Posted speed limit on all roads: 70 km/h Road 1 and Road 3 are 45 ft wide Road 2 and Road 4 are 60ft wide Right turn lanes are 60 m long Pedestrian crosswalks on all approaches have 10+Xft effective crosswalk width, where X is the last digit of your student number Average walking speed of pedestrians = 3.0 ft/sec Estimated maximum number of pedestrians crossing any of the four approaches is 25 per phase Paseo he JIL JL I IS 31 I -11 alr hr Phase Displayed Green (sec) Table 3: Traffic signal timing data Displayed Displayed Intergreen Start up lost Yellow Red (sec) (sec) time (sec) (sec) 4 51 2 4 81 6 2 4 76 6 2 4 85 6 2 6 A B C D 40 10 15 6 Clearance lost time (sec) 1.5 2 1.5 2 Task 3 Part A: For the given information above, perform the following tasks. Report results with detailed calculation steps in your report. Note any assumptions made with justification. i. Determine the total lost time in a 24 hour period. Comment on strategies to reduce this lost time. ii. Calculate the required pedestrian crossing time for Phase A. Determine if the phase timing data would meet the requirements for this pedestrian crossing time. Task 3 Part B: In addition to the information provided in Part A, consider that the below information is known for the Road 1 approach. Average speed of 70 km/h and average flow of 1100 veh/h/In Jam density of 155 veh/km Saturation flow of 2100 veh/h/In with corresponding density of 70 veh/In Showing detailed calculations, compute the following: Speed of the frontal stationary shockwave at the Road 1 approach Speed of the backward recovery shockwave as vehicles start moving at green light on Road 1 approach Compute the queue length at a time point when the queue is dissipated on Road 1 approach
Step by Step Solution
There are 3 Steps involved in it

Get step-by-step solutions from verified subject matter experts