

Question: Q 4 ) For the pipeflow system shown in Fig. below the following data are available: table [ [ Item , Point 1 ,
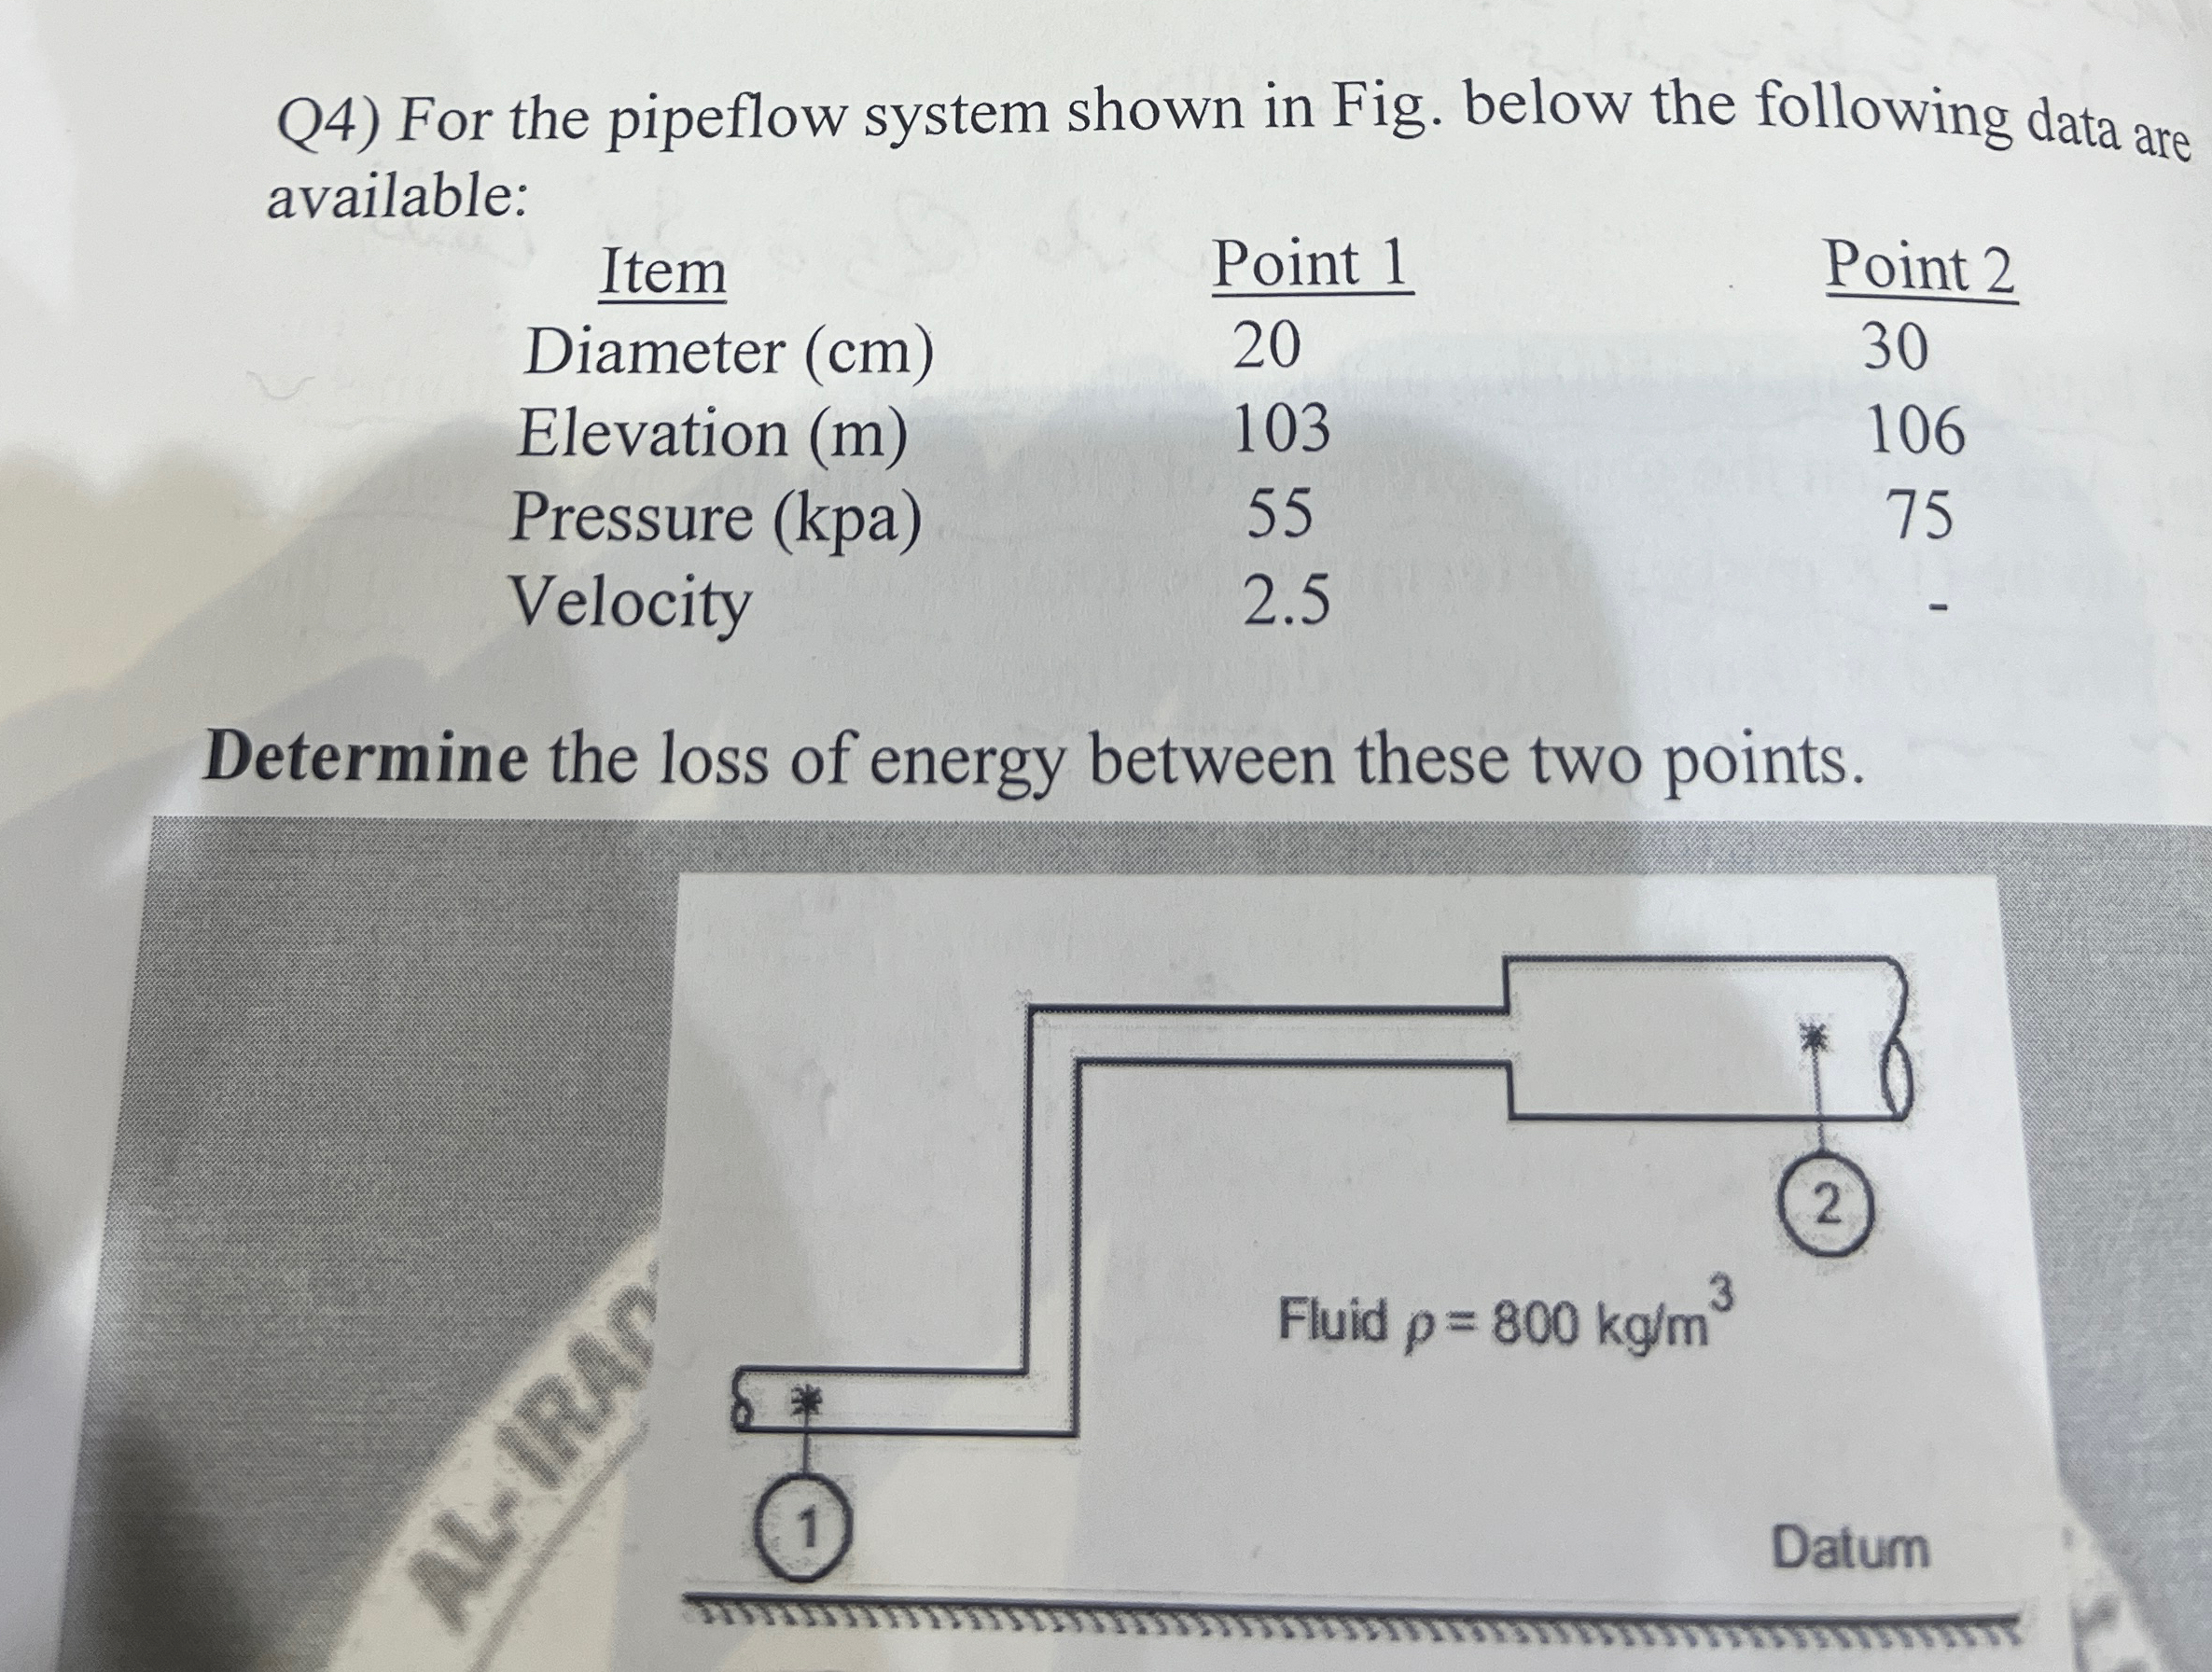
Q For the pipeflow system shown in Fig. below the following data are available:
tableItemPoint Point Diameter Elevation mPressure kpaVelocity
Determine the loss of energy between these two points.
Step by Step Solution
There are 3 Steps involved in it
1 Expert Approved Answer
Step: 1 Unlock

Question Has Been Solved by an Expert!
Get step-by-step solutions from verified subject matter experts
Step: 2 Unlock
Step: 3 Unlock