

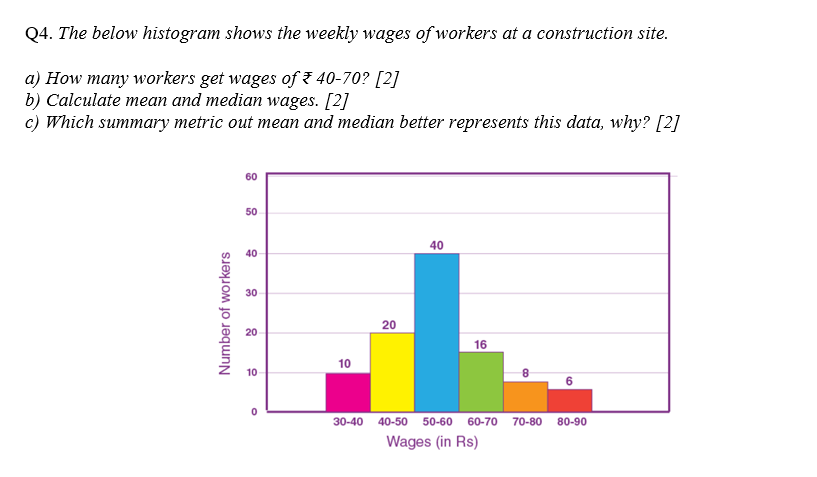
Question: Q 4 . The below histogram shows the weekly wages of workers at a construction site. a ) How many workers get wages of 4
Q The below histogram shows the weekly wages of workers at a construction site.
a How many workers get wages of
b Calculate mean and median wages.
c Which summary metric out mean and median better represents this data, why?
Step by Step Solution
There are 3 Steps involved in it
1 Expert Approved Answer
Step: 1 Unlock

Question Has Been Solved by an Expert!
Get step-by-step solutions from verified subject matter experts
Step: 2 Unlock
Step: 3 Unlock