

Question: Q 5 . The plot below depicts the sample points from X . We want a one - dimensional representation of the data, so draw
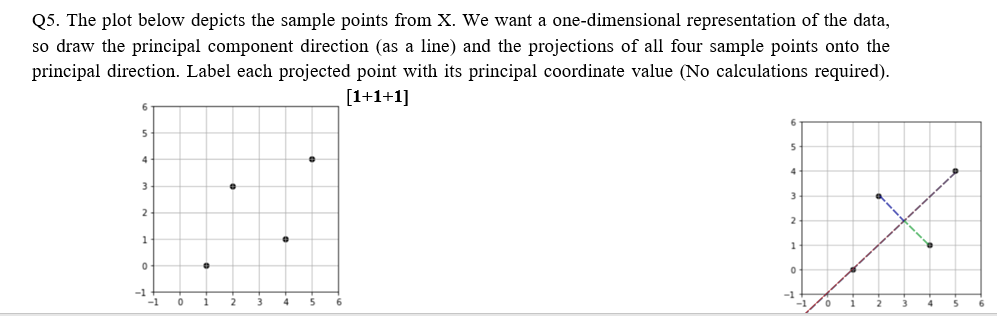
Q The plot below depicts the sample points from X We want a onedimensional representation of the data,
so draw the principal component direction as a line and the projections of all four sample points onto the
principal direction. Label each projected point with its principal coordinate value No calculations required
:
Step by Step Solution
There are 3 Steps involved in it
1 Expert Approved Answer
Step: 1 Unlock

Question Has Been Solved by an Expert!
Get step-by-step solutions from verified subject matter experts
Step: 2 Unlock
Step: 3 Unlock