

Question: Q 5 . The table given below shows the time to death Y ( in weeks ) and the white blood cell count x (
Q
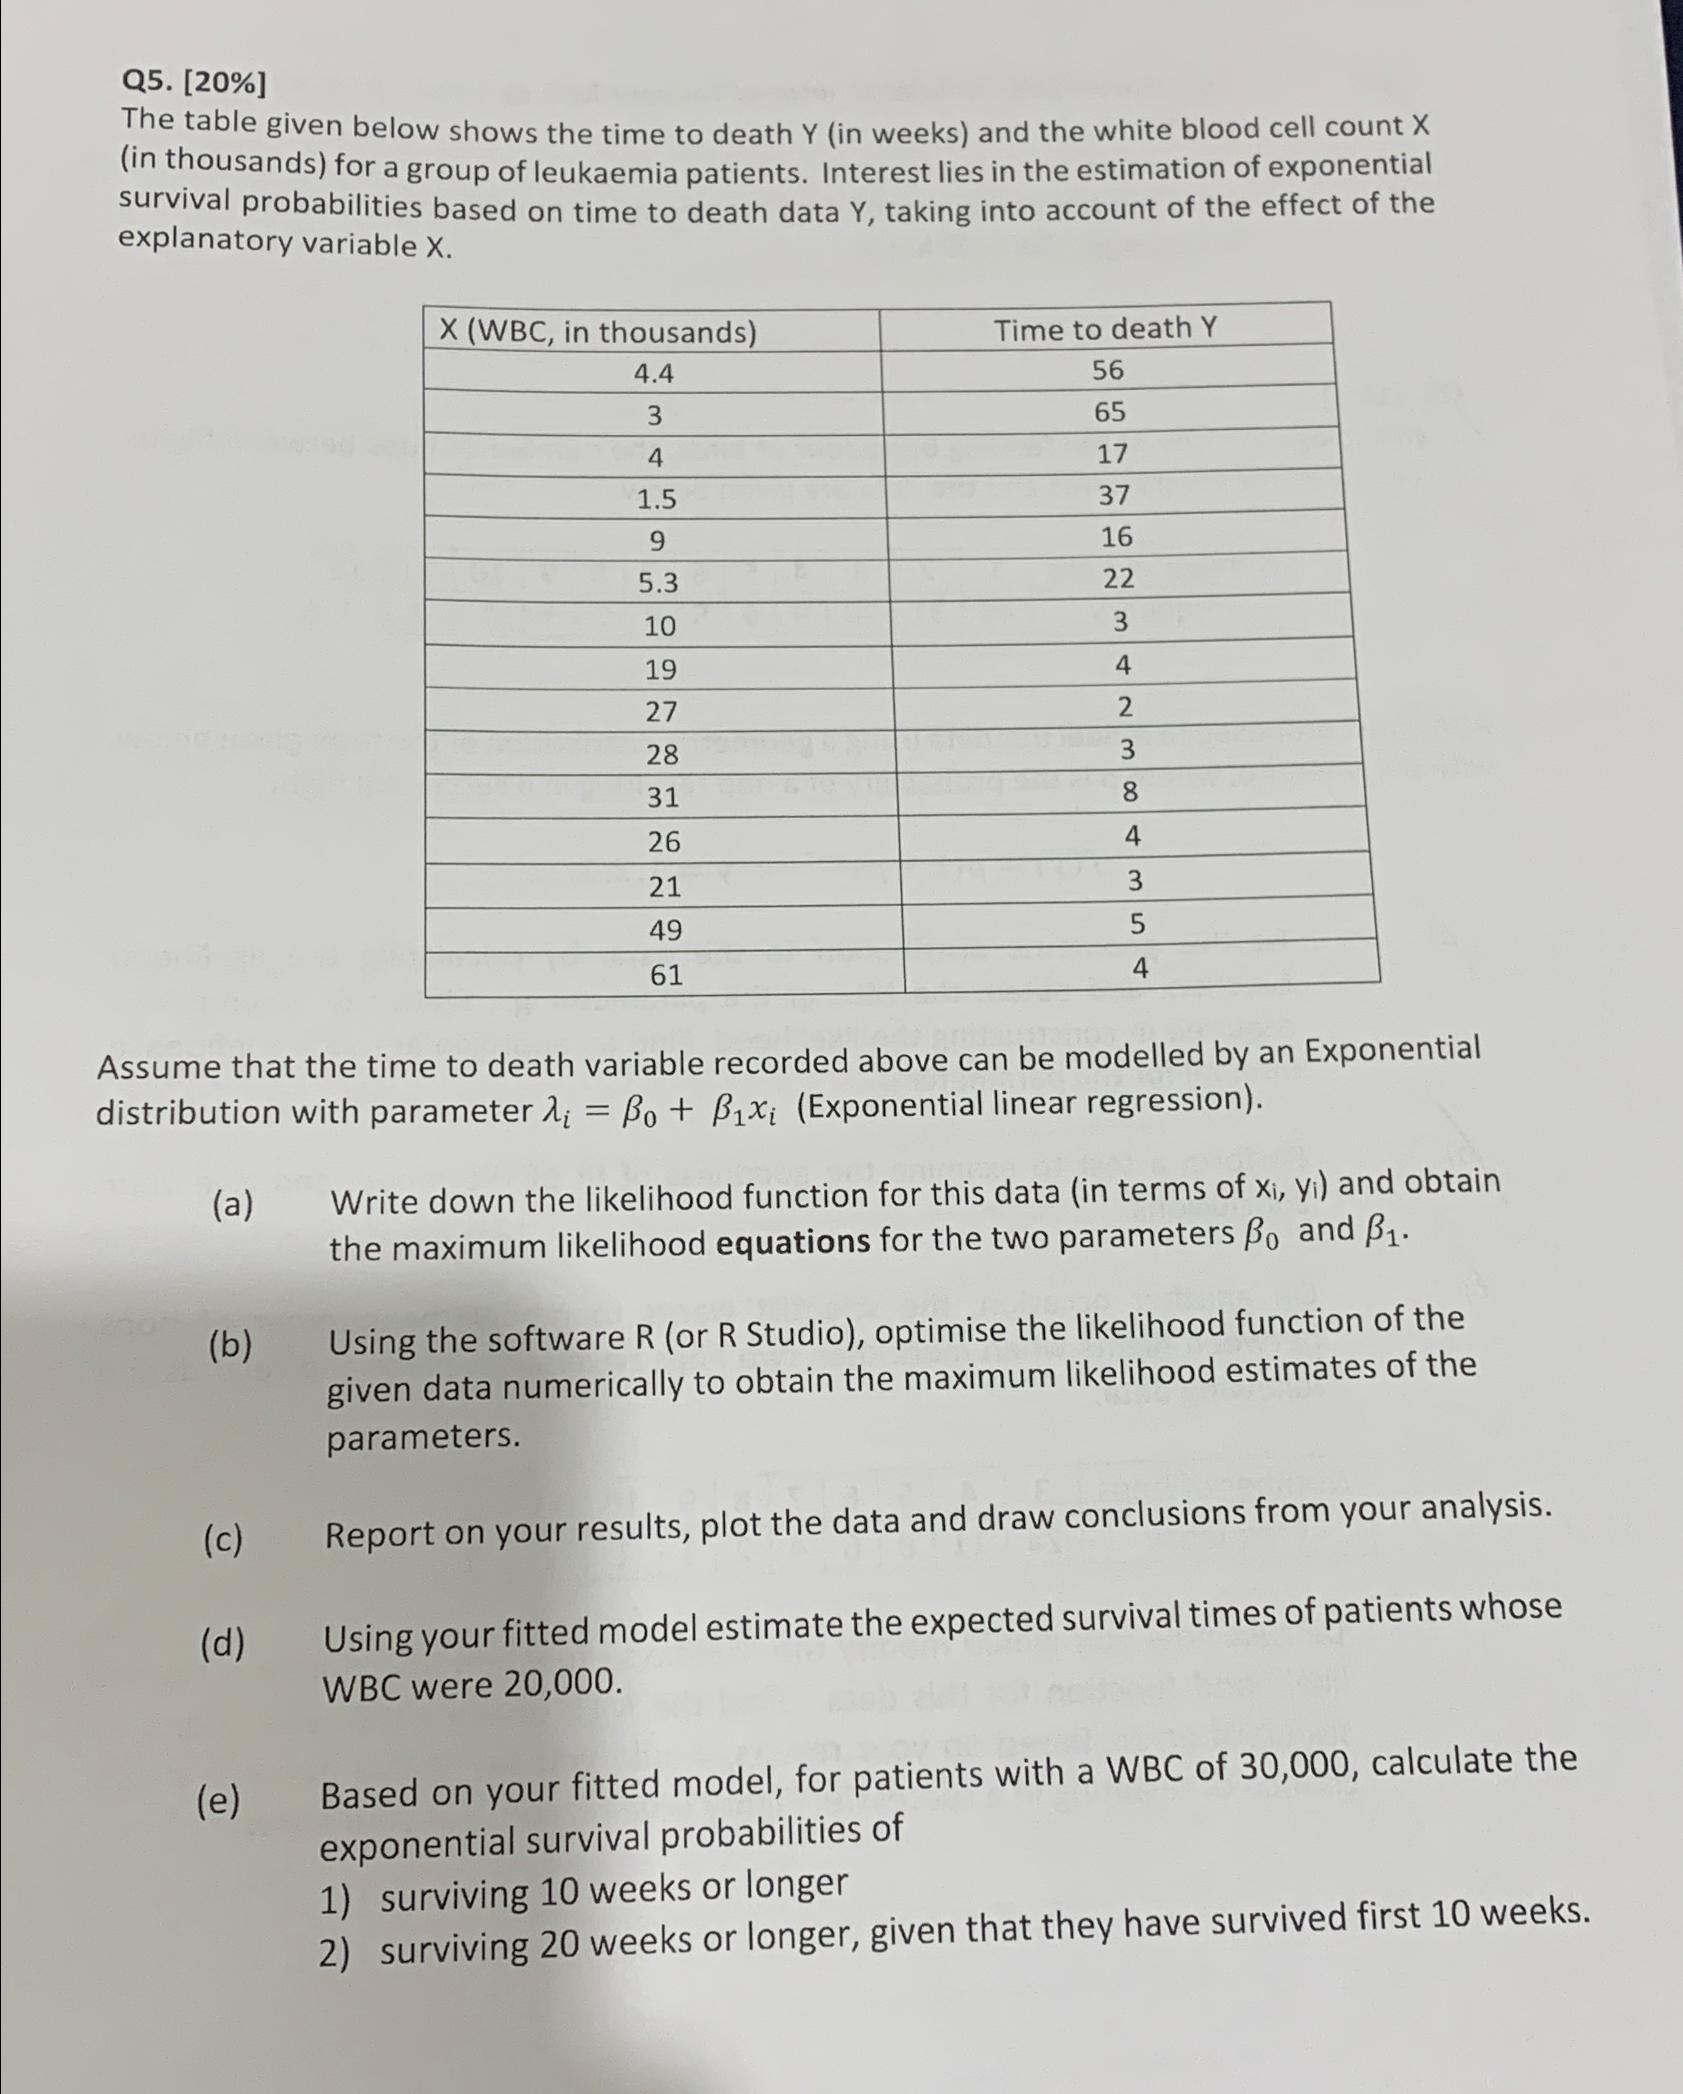
The table given below shows the time to death in weeks and the white blood cell count in thousands for a group of leukaemia patients. Interest lies in the estimation of exponential survival probabilities based on time to death data taking into account of the effect of the explanatory variable
tableWBC in thousandsTime to death
Step by Step Solution
There are 3 Steps involved in it
1 Expert Approved Answer
Step: 1 Unlock

Question Has Been Solved by an Expert!
Get step-by-step solutions from verified subject matter experts
Step: 2 Unlock
Step: 3 Unlock