

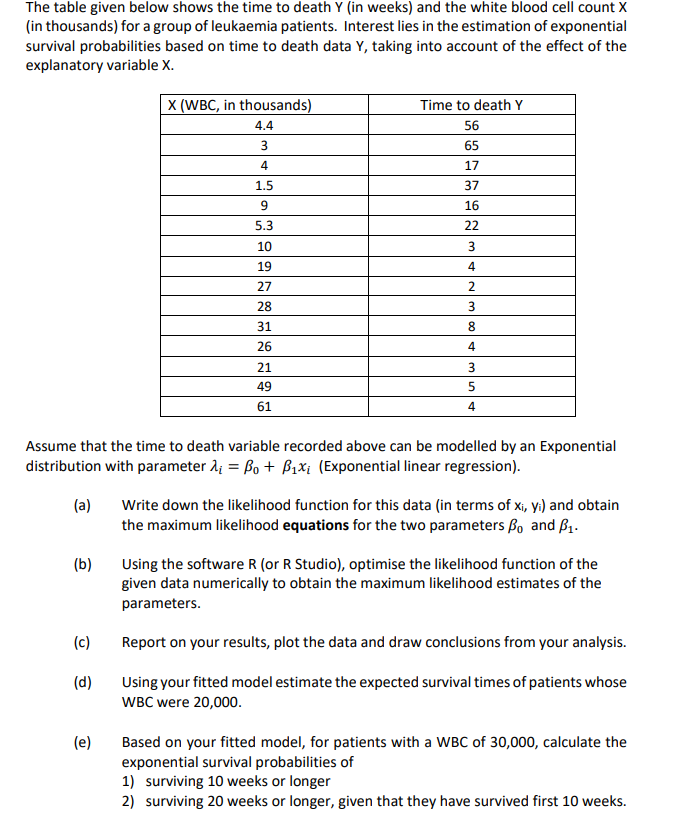
Question: The table given below shows the time to death Y ( in weeks ) and the white blood cell count x ( in thousands )
The table given below shows the time to death in weeks and the white blood cell count
in thousands for a group of leukaemia patients. Interest lies in the estimation of exponential
survival probabilities based on time to death data taking into account of the effect of the
explanatory variable
Assume that the time to death variable recorded above can be modelled by an Exponential
distribution with parameter Exponential linear regression
a Write down the likelihood function for this data in terms of and obtain
the maximum likelihood equations for the two parameters and
b Using the software R or R Studio optimise the likelihood function of the
given data numerically to obtain the maximum likelihood estimates of the
parameters.
c Report on your results, plot the data and draw conclusions from your analysis.
d Using your fitted model estimate the expected survival times of patients whose
WBC were
e Based on your fitted model, for patients with a WBC of calculate the
exponential survival probabilities of
surviving weeks or longer
surviving weeks or longer, given that they have survived first weeks.
Step by Step Solution
There are 3 Steps involved in it
1 Expert Approved Answer
Step: 1 Unlock

Question Has Been Solved by an Expert!
Get step-by-step solutions from verified subject matter experts
Step: 2 Unlock
Step: 3 Unlock