

Question: Q 7 Identify the correct image and graph which accurately depicts the slump test results and the 2 8 - Day Compressive Strength graph showing
Q
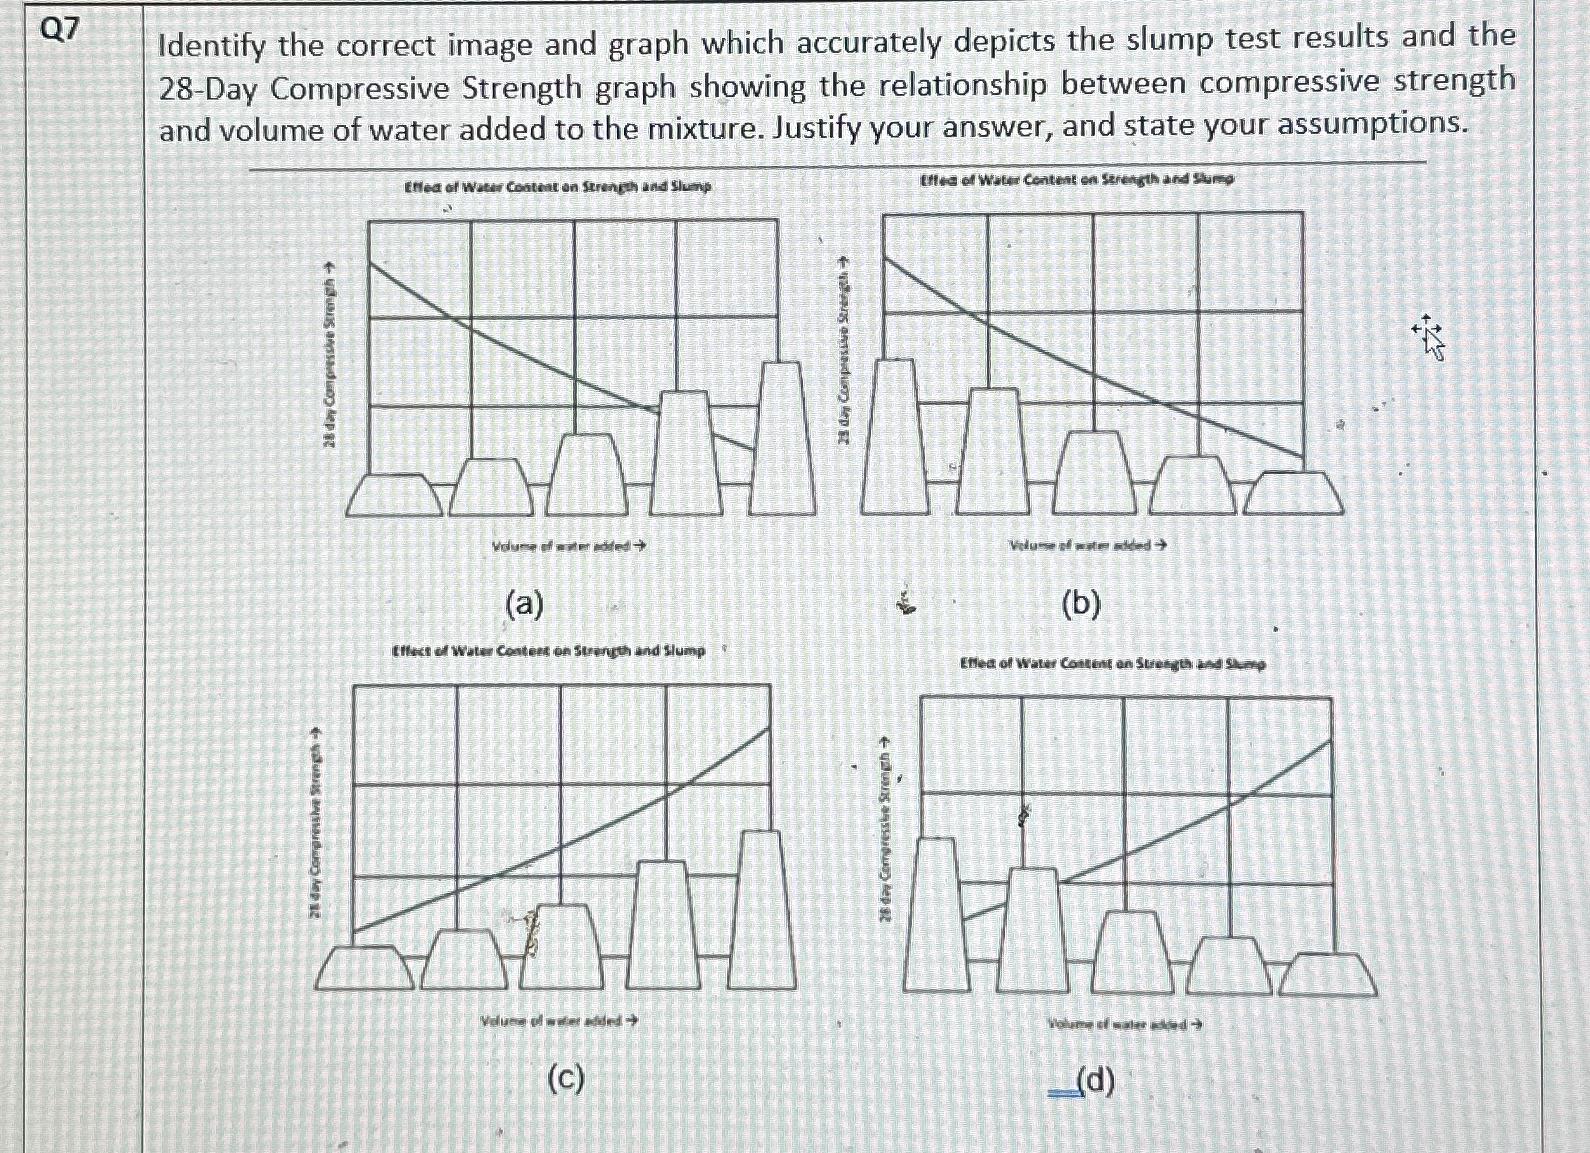
Identify the correct image and graph which accurately depicts the slump test results and the Day Compressive Strength graph showing the relationship between compressive strength and volume of water added to the mixture. Justify your answer, and state your assumptions.
Viduse if wive alled
a
b
tituct of Wuter contert on strungth and Hump
c
d
Step by Step Solution
There are 3 Steps involved in it
1 Expert Approved Answer
Step: 1 Unlock

Question Has Been Solved by an Expert!
Get step-by-step solutions from verified subject matter experts
Step: 2 Unlock
Step: 3 Unlock