

Question: q , are charts that graph quantitative changes in service performance on a specific variable relative to a predefined standard. Perceptual charts Control charts Correlation
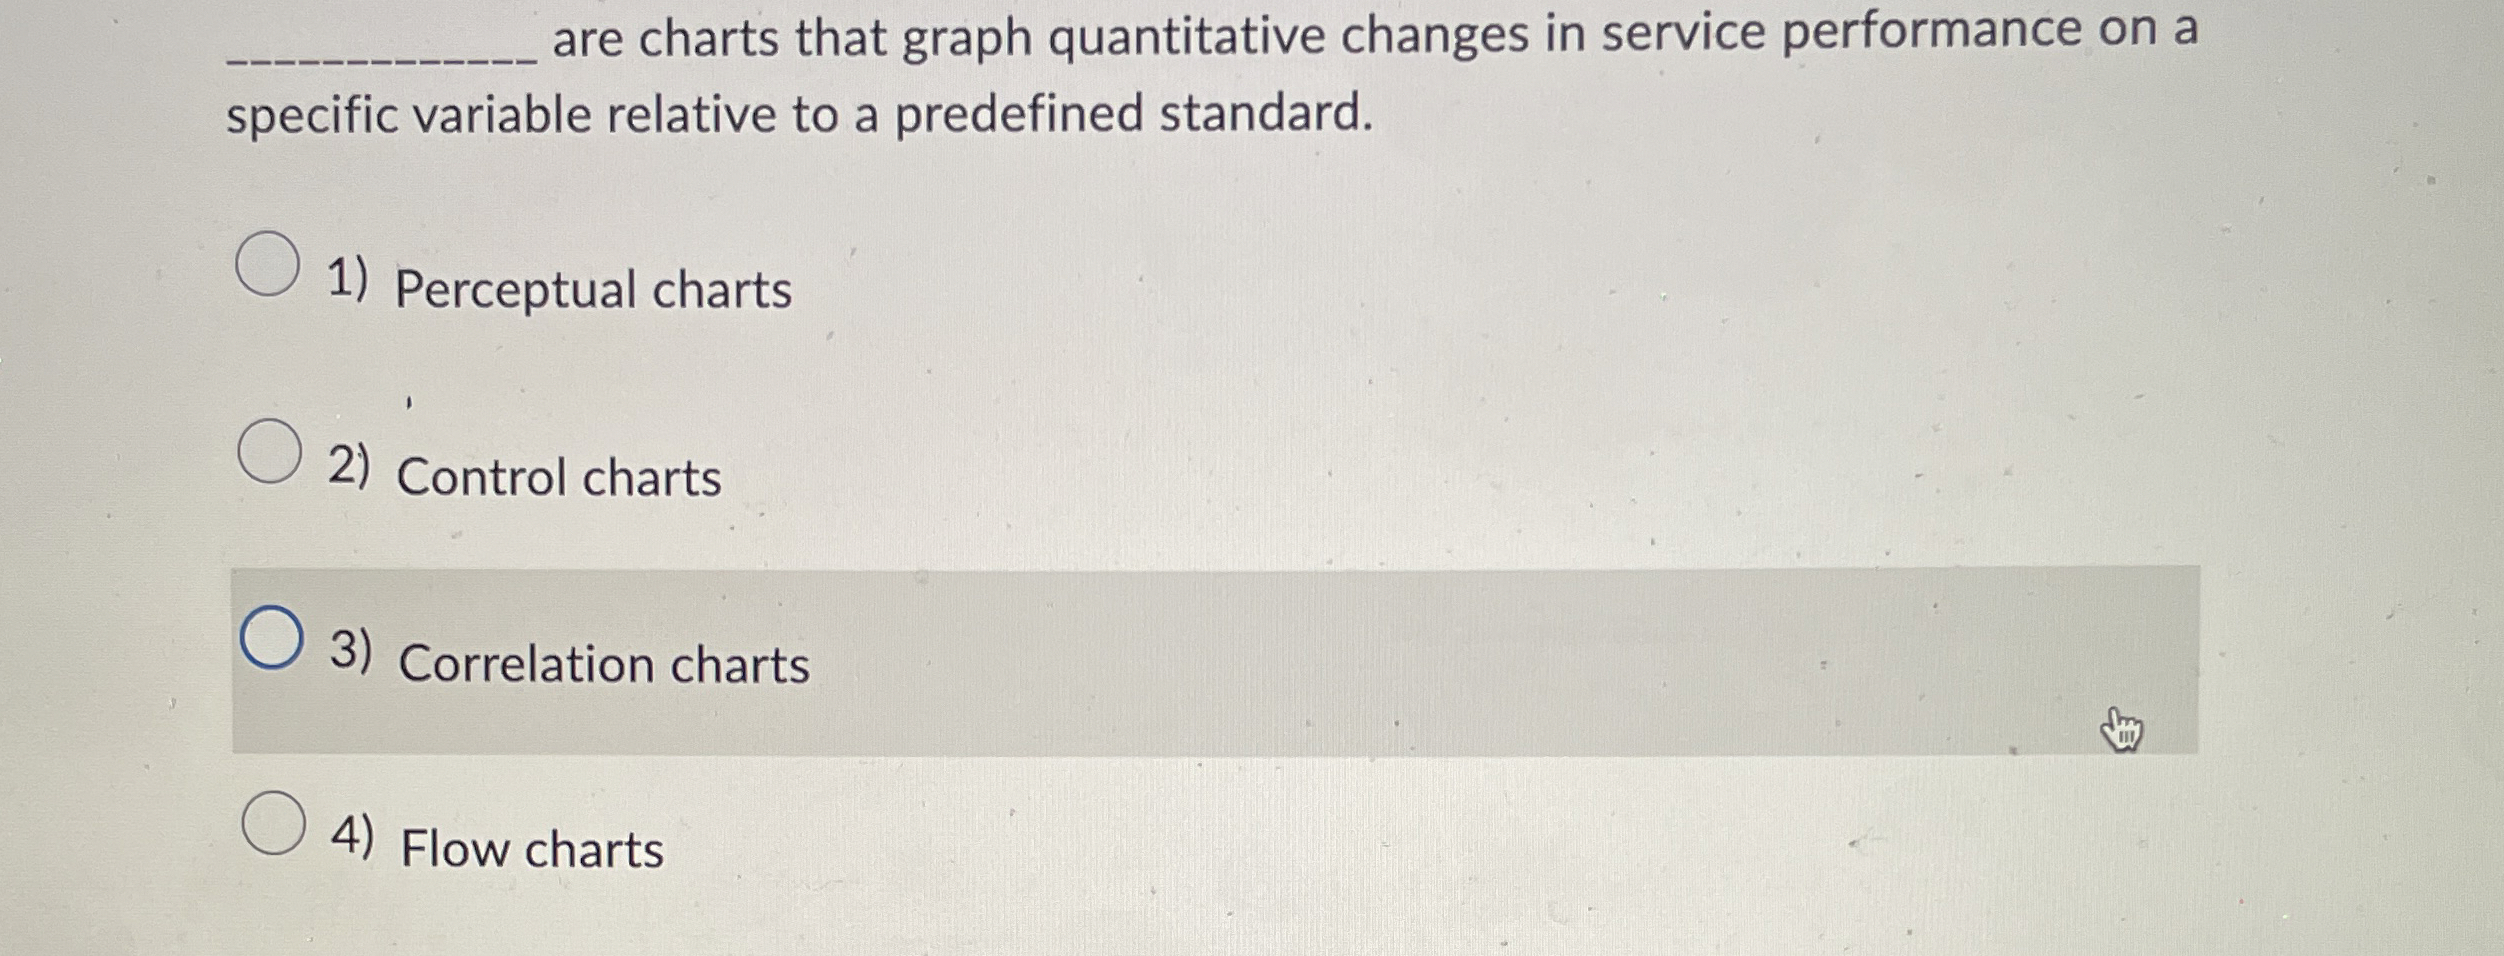
are charts that graph quantitative changes in service performance on a specific variable relative to a predefined standard.
Perceptual charts
Control charts
Correlation charts
Flow charts
Step by Step Solution
There are 3 Steps involved in it
1 Expert Approved Answer
Step: 1 Unlock

Question Has Been Solved by an Expert!
Get step-by-step solutions from verified subject matter experts
Step: 2 Unlock
Step: 3 Unlock