

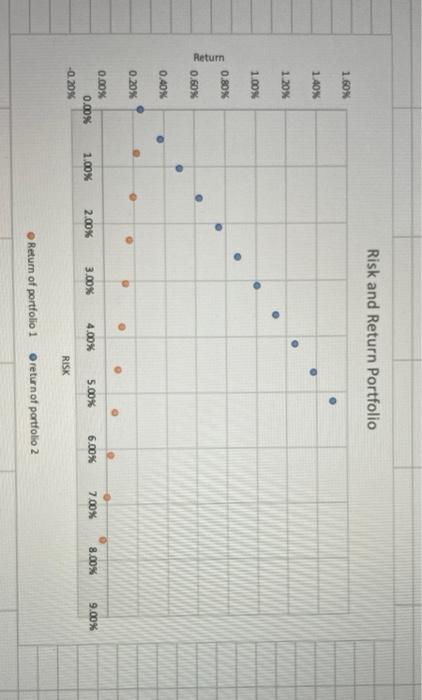
Question: Q) Based on the graph, explain how we can see the tradeoff between risk and return and identify which stock you would prefer to combine
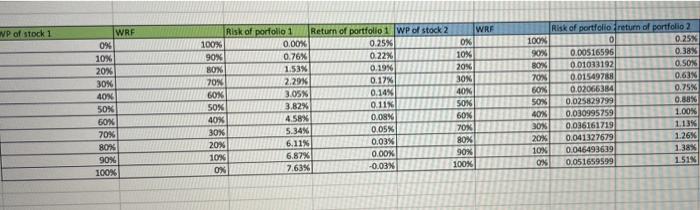
VP of stock 1 WRF 0% 10% 20% 30% 40% 50% 50% 70% 80% 90% 100% Risk of porfolio 1 Return of portfolio 1 WP of stock 2 WRF 100% 0.00% 0.25% 0% 90% 0.76% 0.22% 10% BOX 1.53N 0.19% 20% 70W 2.29% 0.17% 30N 60% 3.05 0.14% 40W SOX 3.82% 0.11% 50% 40% 4.58% 0.09% 60% 30% 5.34% 0.05% 70% 20% 6.11% 0.03% 80% 10% 6.82% 0.00% 90% OX 7.63% -0.03% 100% Risk of portfolio return of portfolio 2 100% 0 0.25% 90% 0.00516596 0.38% 80% 0.01033192 O. SON 70% 0.01549788 0.63% 60 0.02066384 0.75% 50 0.025829799 0.88% AON 0.030995759 1.00% 30 0.036161719 1.13% 20% 0.041327679 1.26% 10% 0.046493639 138% ON 0.051659599 1513 Risk and Return Portfolio 1.60% 1.40% 1.20% 1.00% . 0.80% . . Return 0.60% . 0.40% 0.20% . 2.00% 0.00% 0.00% -0.20% 3.00% 6.00% 4.00% 7.00% 5.00% 1.00% 9.00% 8.00% RISK Return of portfolio 1 return of portfolio 2
Step by Step Solution
There are 3 Steps involved in it

Get step-by-step solutions from verified subject matter experts