

Question: Q No.1) a) Construct the Histogram for the following frequency distribution relating to the ages of telephone operators. Age (Years) No. of Operators 10---15
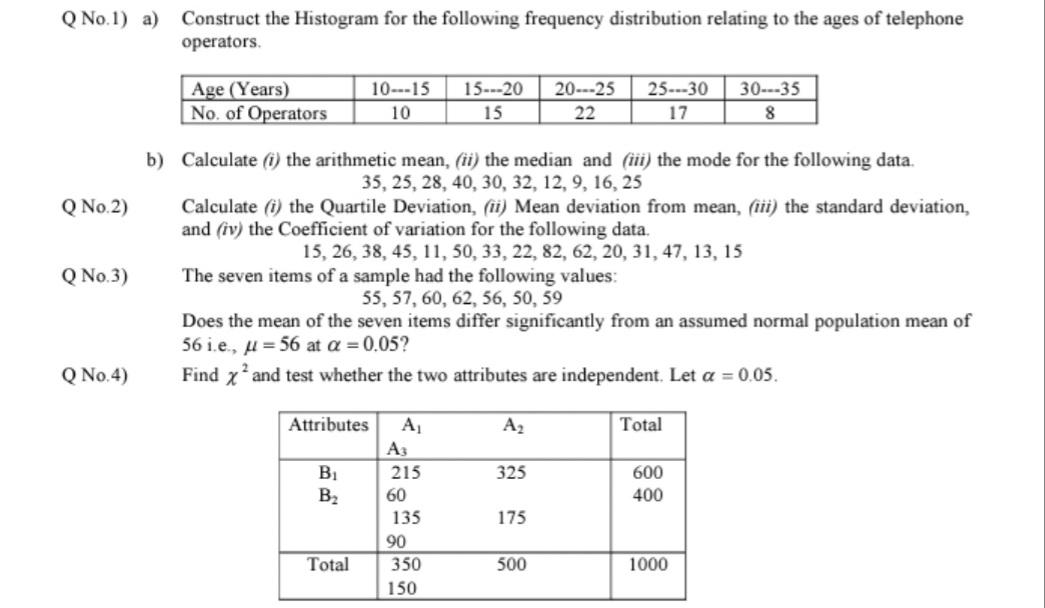
Q No.1) a) Construct the Histogram for the following frequency distribution relating to the ages of telephone operators. Age (Years) No. of Operators 10---15 15---20 20---25 25--30 30---35 10 15 22 17 8 b) Calculate (i) the arithmetic mean, (ii) the median and (ii) the mode for the following data. 35, 25, 28, 40, 30, 32, 12, 9, 16, 25 Q No.2) Calculate (i) the Quartile Deviation, (ii) Mean deviation from mean, (iii) the standard deviation, and (iv) the Coefficient of variation for the following data. 15, 26, 38, 45, 11, 50, 33, 22, 82, 62, 20, 31, 47, 13, 15 Q No.3) The seven items of a sample had the following values: 55, 57, 60, 62, 56, 50, 59 Does the mean of the seven items differ significantly from an assumed normal population mean of 56 i.e., u = 56 at a = 0.05? Q No.4) Find x* and test whether the two attributes are independent. Let a = 0.05. Attributes A1 A2 Total A3 B1 B2 215 325 600 60 400 135 175 90 Total 350 500 1000 150
Step by Step Solution
There are 3 Steps involved in it

Get step-by-step solutions from verified subject matter experts