

Question: Q Table 2 Maximum Deviation Rates for Attribute Sampling Desired Confidence Level = 95 Percent Sample Size Actual Number of Deviations Found 0 1 2
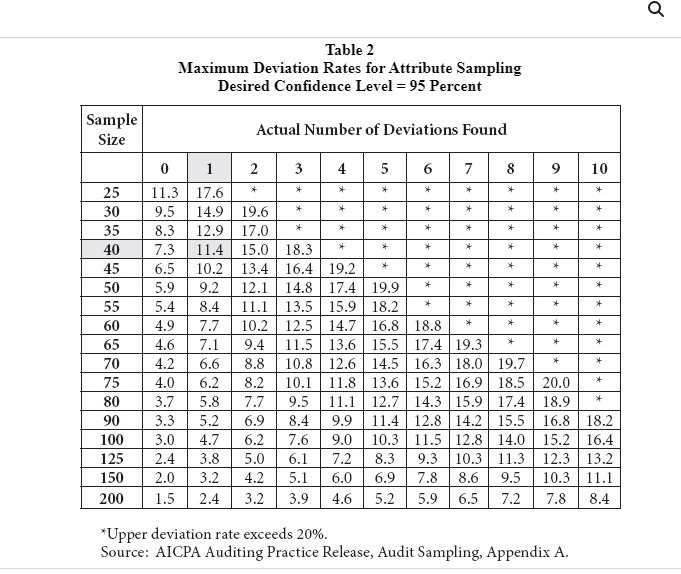
Q Table 2 Maximum Deviation Rates for Attribute Sampling Desired Confidence Level = 95 Percent Sample Size Actual Number of Deviations Found 0 1 2 3 4 5 6 7 8 9 10 25 11.3 17.6 30 9.5 14.9 19.6 35 8.3 12.9 17.0 40 7.3 11.4 15.0 18.3 45 6.5 10.2 13.4 16.4 19.2 + * * 50 5.9 9.2 12.1 14.8 17.4 19.9 55 5.4 8.4 11.1 13.5 15.9 18.2 * 60 4.9 7.7 10.2 12.5 14.7 16.8 18.8 * 65 4.6 7.1 9.4 11.5 13.6 15.5 17.4 19.3 70 4.2 6.6 8.8 10.8 12.6 14.5 16.3 18.0 19.7 75 4.0 6.2 8.2 10.1 11.8 13.6 15.2 16.9 18.5 20.0 80 3.7 5.8 7.7 9.5 11.1 12.7 14.3 15.9 17.4 18.9 90 3.3 5.2 6.9 8.4 9.9 11.4 12.8 14.2 15.5 16.8 18.2 100 3.0 4.7 6.2 7.6 9.0 10.3 11.5 12.8 14.0 15.2 16.4 125 2.4 3.8 5.0 6.1 7.2 8.3 9.3 10.3 11.3 12.3 13.2 150 2.0 3.2 4.2 5.1 6.0 6.9 7.8 8.6 9.5 10.3 11.1 200 1.5 2.4 3.2 3.9 4.6 5.2 5.9 6.5 7.2 7.8 8.4 *Upper deviation rate exceeds 20%. Source: AICPA Auditing Practice Release, Audit Sampling, Appendix A
Step by Step Solution
There are 3 Steps involved in it

Get step-by-step solutions from verified subject matter experts