

Question: Q . The previous codes fit a model using the entire golf data set. The next set of code splits the data set in a
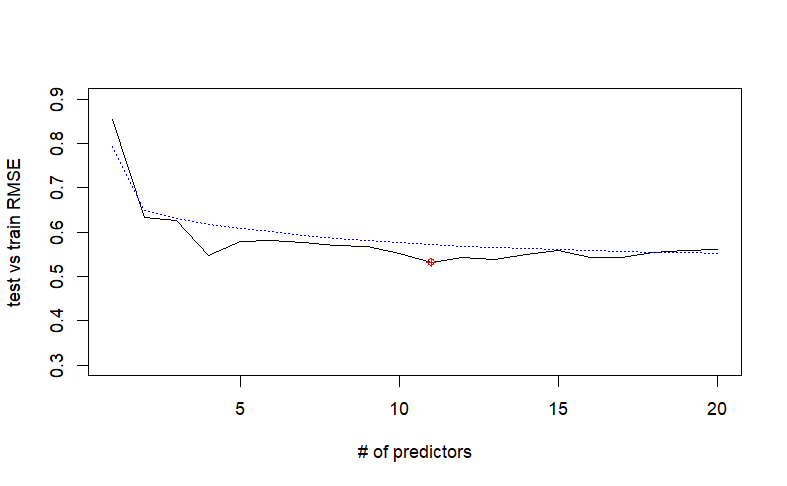
QThe previous codes fit a model using the entire golf data set. The next set of code splits the data set in a training and validation set and provides the MSE metric for both sets. What does the test MSE suggest that the appropriate number of predictors should be Are there any signs of overfitting based on the graphic? What happens if you change the split to explain the graph which is in image and please read the question very carefully
r
librarycaret
set.seed
trainIndexcreateDataPartitiongolf$AvgWinnings,plistF #p: proportion of data in train
traininggolftrainIndex
validategolftrainIndex,
fwdtrainregsubsetslogAvgWinnings~datatraining,method"forward",nvmax
#Creating a prediction function
predict.regsubsets function object newdata id
formasformula object$call
matmodel.matrixform newdata
coeficoefobject idid
xvarsnamescoefi
matxvarscoefi
valMSEc
#note my index, i is to since that is how many predictors I went up to during fwd selection
for i in :
predictionspredict.regsubsetsobjectfwdtrain,newdatavalidate,idi
valMSEimeanlogvalidate$AvgWinningspredictions
parmfrowc
plot:sqrtvalMSEtypelxlab# of predictors",ylab"test vs train RMSE",ylimc
indexwhichvalMSEminvalMSE
pointsindexsqrtvalMSEindexcol"red",pch
trainMSEsummaryfwdtrain$rssnrowtraining
lines:sqrttrainMSEltycol"blue"
Step by Step Solution
There are 3 Steps involved in it
1 Expert Approved Answer
Step: 1 Unlock

Question Has Been Solved by an Expert!
Get step-by-step solutions from verified subject matter experts
Step: 2 Unlock
Step: 3 Unlock