

Question: Q: Write a Matlab code that generates a 3x3 plot (i.e. nine subplots). Each subplot should represent a sinusoidal of the form Sin (2mft )
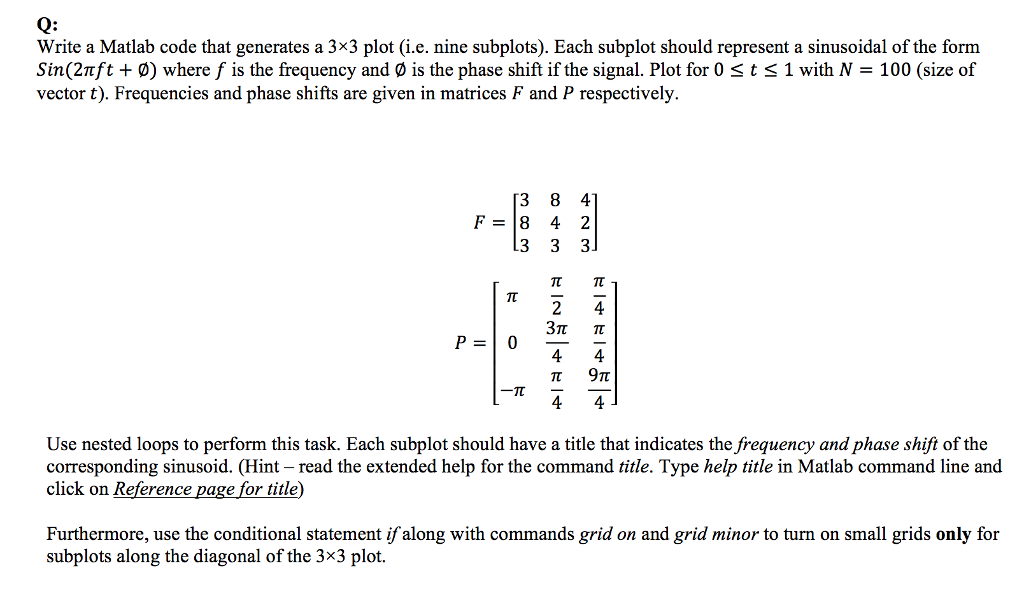
Q: Write a Matlab code that generates a 3x3 plot (i.e. nine subplots). Each subplot should represent a sinusoidal of the form Sin (2mft ) where f is the frequency and 0 is the phase shift if the signal. Plot for 0 t 1 with N- 100 (size of vector t). Frequencies and phase shifts are given in matrices F and P respectively. 33 F- 8 4 2 Use nested loops to perform this task. Each subplot should have a title that indicates the frequency and phase shift of the corresponding sinusoid. (Hint read the extended help for the command title. Type help title in Matlab command line and click on Reference page for title) Furthermore, use the conditional statement ifalong with commands grid on and grid minor to turn on small grids only for subplots along the diagonal of the 3*3 plot
Step by Step Solution
There are 3 Steps involved in it

Get step-by-step solutions from verified subject matter experts