

Question: Q1 (10 points) x y 1 5 1 3 1 5 1 7 2 3 2 3 2 1 3 1 3 1 4 1

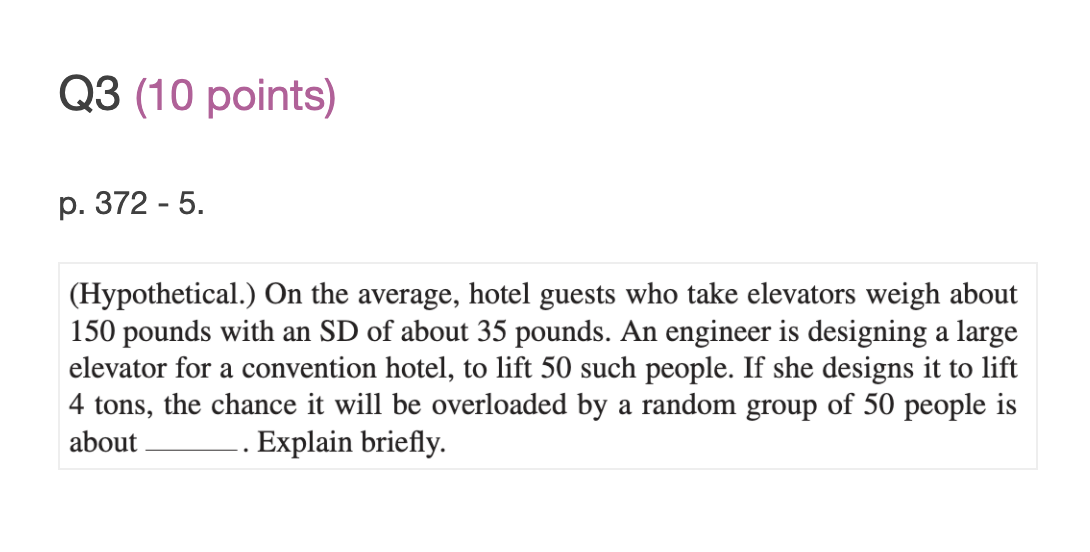

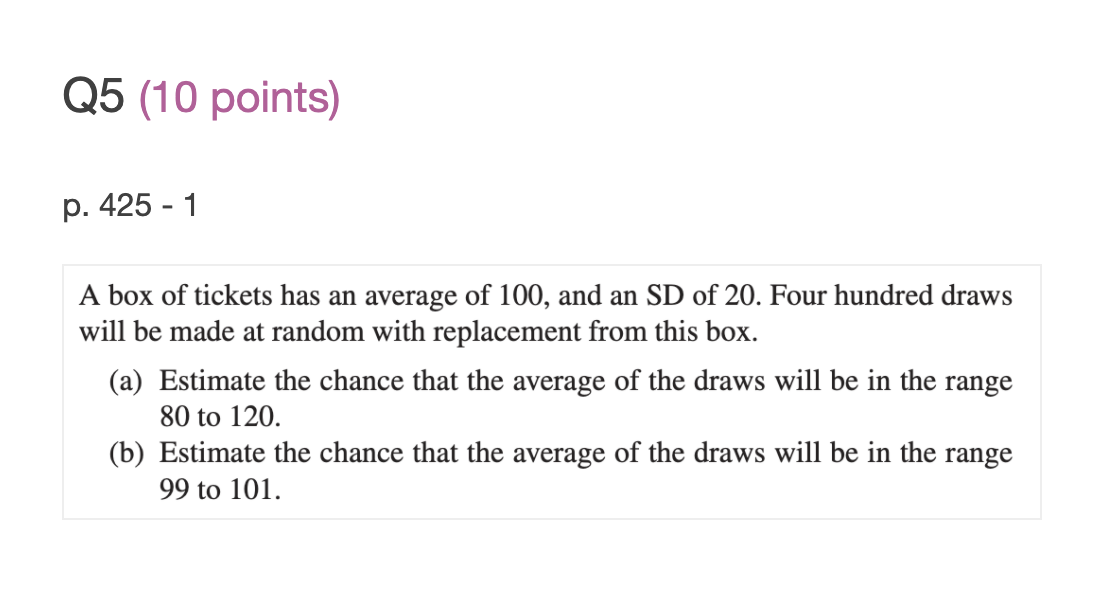
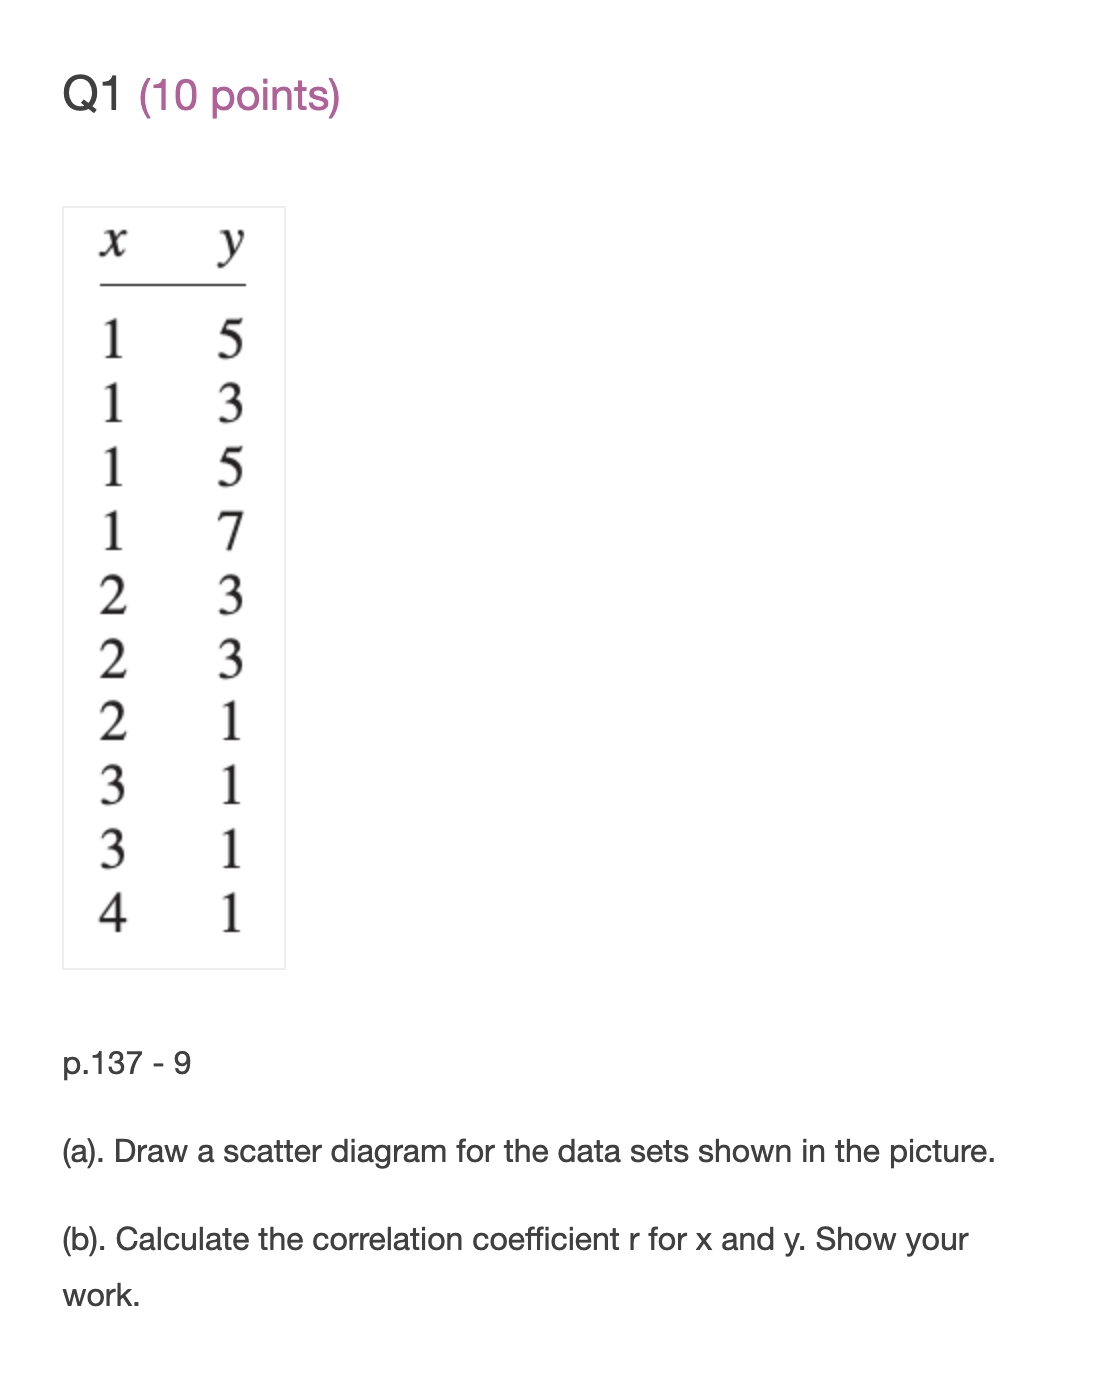
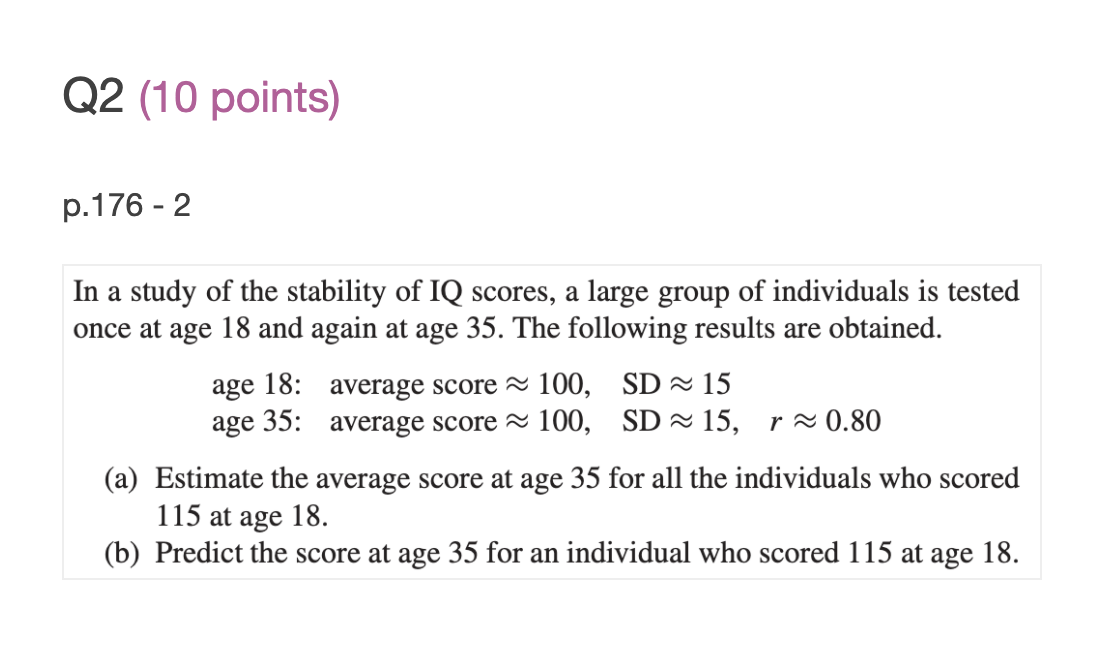

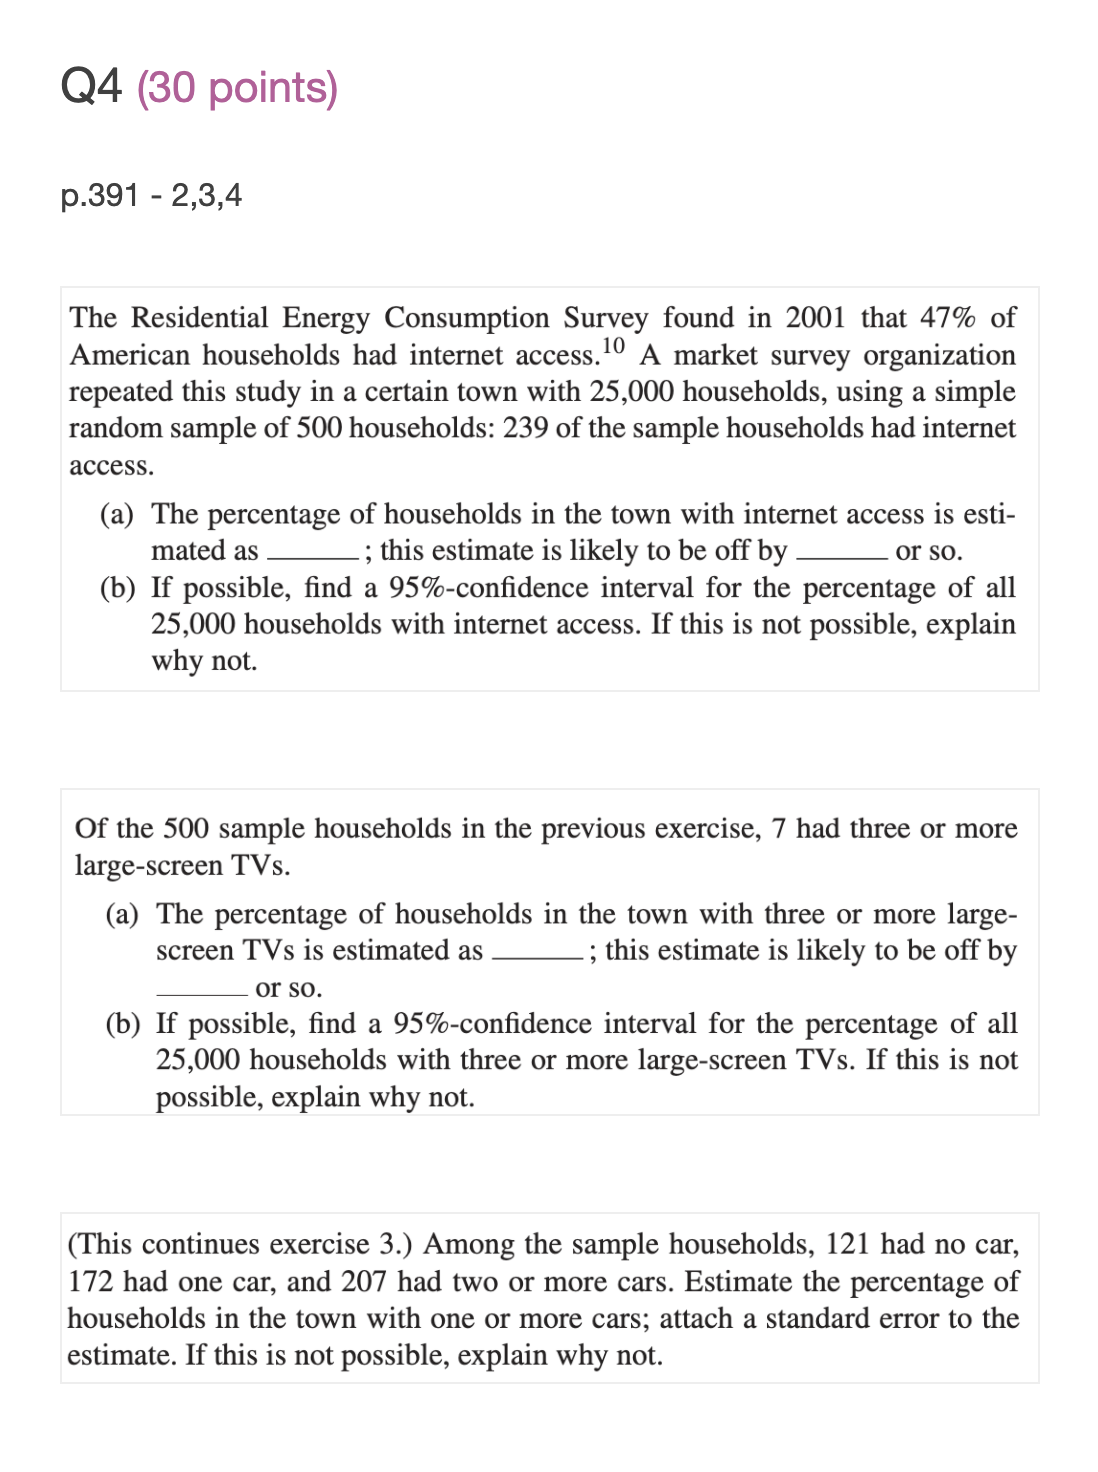

Q1 (10 points) x y 1 5 1 3 1 5 1 7 2 3 2 3 2 1 3 1 3 1 4 1 p.137 -9 (a). Draw a scatter diagram for the data sets shown in the picture. (b). Calculate the correlation coefficient r for x and y. Show your work. 02 (10 points) p.176-2 In a study of the stability of IQ scores, a large group of individuals is tested once at age 18 and again at age 35. The following results are obtained. age 18: average score m 100, SD m 15 age 35: average score m 100, SD m 15, r m 0.80 (a) Estimate the average score at age 35 for all the individuals who scored 115 at age 18. (b) Predict the score at age 35 for an individual who scored 115 at age 18. Q3 (10 points) p. 372 - 5. (Hypothetical.) 0n the average, hotel guests who take elevators weigh about 150 pounds with an SD of about 35 pounds. An engineer is designing a large elevator for a convention hotel, to lift 50 such people. If she designs it to lift 4 tons, the chance it will be overloaded by a random group of 50 people is about . Explain briey. Q4 (30 points) p.391 - 2,3,4 The Residential Energy Consumption Survey found in 2001 that 47% of American households had internet access. A market survey organization repeated this study in a certain town with 25,000 households, using a simple random sample of 500 households: 239 of the sample households had internet access. (a) The percentage of households in the town with internet access is esti- mated as ; this estimate is likely to be off by or so. (b) If possible, find a 95%-confidence interval for the percentage of all 25,000 households with internet access. If this is not possible, explain why not. Of the 500 sample households in the previous exercise, 7 had three or more large-screen TVs. (a) The percentage of households in the town with three or more large- screen TVs is estimated as -; this estimate is likely to be off by or so. (b) If possible, find a 95%-confidence interval for the percentage of all 25,000 households with three or more large-screen TVs. If this is not possible, explain why not. (This continues exercise 3.) Among the sample households, 121 had no car, 172 had one car, and 207 had two or more cars. Estimate the percentage of households in the town with one or more cars; attach a standard error to the estimate. If this is not possible, explain why not.Q5 (10 points) p. 425 -1 A box of tickets has an average of 100, and an SD of 20. Four hundred draws will be made at random with replacement from this box. (a) Estimate the chance that the average of the draws will be in the range 80 to 120. (b) Estimate the chance that the average of the draws will be in the range 99 to 101
Step by Step Solution
There are 3 Steps involved in it

Get step-by-step solutions from verified subject matter experts