

Q.1 : Figure below shows grain size distribution curves for soils E, F, G and H with
Fantastic news! We've Found the answer you've been seeking!
Question:
Q.1 : Figure below shows grain size distribution curves for soils
E, F, G and H with their LL and PL values. For each soil,
(a) Classify the soil according to USCS.
(b) Classify the soil according to AASHTO including GI.
(c) Discuss the suitability of the soil as subgrade material. 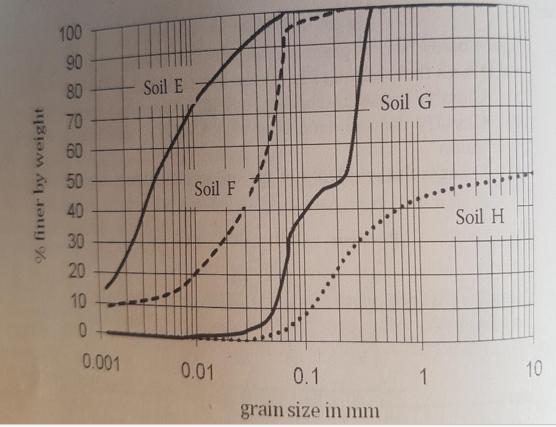
| Soil Type | LL | PL |
| E | 55 | 27 |
| F | 43 | 22 |
| G | 46 | 28 |
| H | 41 | 32 |
SOIL MECHANIC IF YOU ATTEMPTING PLEASE SOLVE PROPERLY THANKS
Expert Answer:

Related Book For 
Posted Date:
