

Question: Q1) In this question, you will use Python to approximate the function f(x) = e2x using polynomials. 1. In Python, generate an array of 100
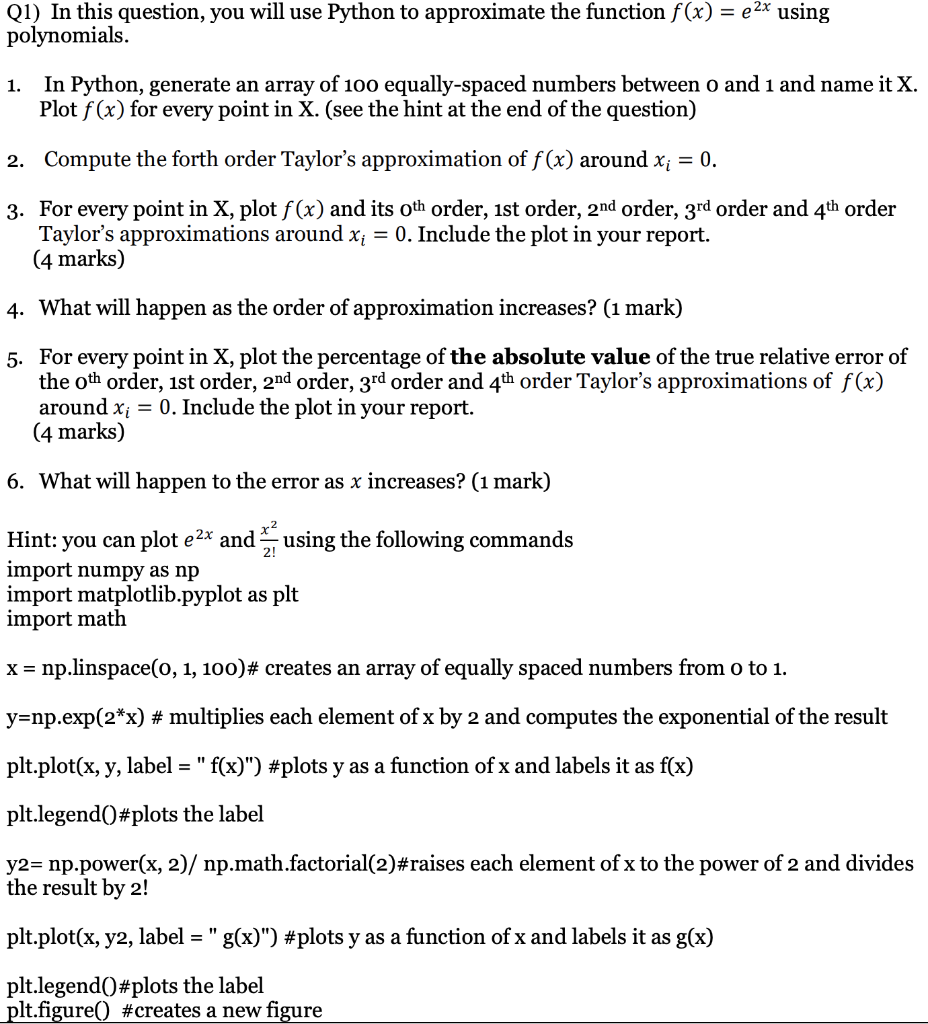
Q1) In this question, you will use Python to approximate the function f(x) = e2x using polynomials. 1. In Python, generate an array of 100 equally-spaced numbers between o and 1 and name it X. Plot f(x) for every point in X. (see the hint at the end of the question) 2. Compute the forth order Taylor's approximation of f(x) around xi = 0. 3. For every point in X, plot f(x) and its oth order, ist order, 2nd order, 3rd order and 4th order Taylor's approximations around xi = 0. Include the plot in your report. (4 marks) 4. What will happen as the order of approximation increases? (1 mark) 5. For every point in X, plot the percentage of the absolute value of the true relative error of the oth order, 1st order, 2nd order, 3rd order and 4th order Taylor's approximations of f(x) around xi = 0. Include the plot in your report. (4 marks) 6. What will happen to the error as x increases? (1 mark) Hint: you can plot e2x and using the following commands import numpy as np import matplotlib.pyplot as plt import math x = np.linspace(0, 1, 100)# creates an array of equally spaced numbers from o to 1. y=np.exp(2*x) # multiplies each element of x by 2 and computes the exponential of the result plt.plot(x, y, label = "f(x)") #plots y as a function of x and labels it as f(x) plt.legend()#plots the label y2= np.power(x, 2)/ np.math.factorial(2)#raises each element of x to the power of 2 and divides the result by 2! plt.plot(x, y2, label = " g(x)") #plots y as a function of x and labels it as g(x) plt.legend()#plots the label plt.figure() #creates a new figure Q1) In this question, you will use Python to approximate the function f(x) = e2x using polynomials. 1. In Python, generate an array of 100 equally-spaced numbers between o and 1 and name it X. Plot f(x) for every point in X. (see the hint at the end of the question) 2. Compute the forth order Taylor's approximation of f(x) around xi = 0. 3. For every point in X, plot f(x) and its oth order, ist order, 2nd order, 3rd order and 4th order Taylor's approximations around xi = 0. Include the plot in your report. (4 marks) 4. What will happen as the order of approximation increases? (1 mark) 5. For every point in X, plot the percentage of the absolute value of the true relative error of the oth order, 1st order, 2nd order, 3rd order and 4th order Taylor's approximations of f(x) around xi = 0. Include the plot in your report. (4 marks) 6. What will happen to the error as x increases? (1 mark) Hint: you can plot e2x and using the following commands import numpy as np import matplotlib.pyplot as plt import math x = np.linspace(0, 1, 100)# creates an array of equally spaced numbers from o to 1. y=np.exp(2*x) # multiplies each element of x by 2 and computes the exponential of the result plt.plot(x, y, label = "f(x)") #plots y as a function of x and labels it as f(x) plt.legend()#plots the label y2= np.power(x, 2)/ np.math.factorial(2)#raises each element of x to the power of 2 and divides the result by 2! plt.plot(x, y2, label = " g(x)") #plots y as a function of x and labels it as g(x) plt.legend()#plots the label plt.figure() #creates a new figure
Step by Step Solution
There are 3 Steps involved in it

Get step-by-step solutions from verified subject matter experts