

Question: Q1 Q2 The table here, , shows the one-year return distribution of Startup Inc. Calculate the: a. Expected return. b. The standard deviation of the
Q1
Q2
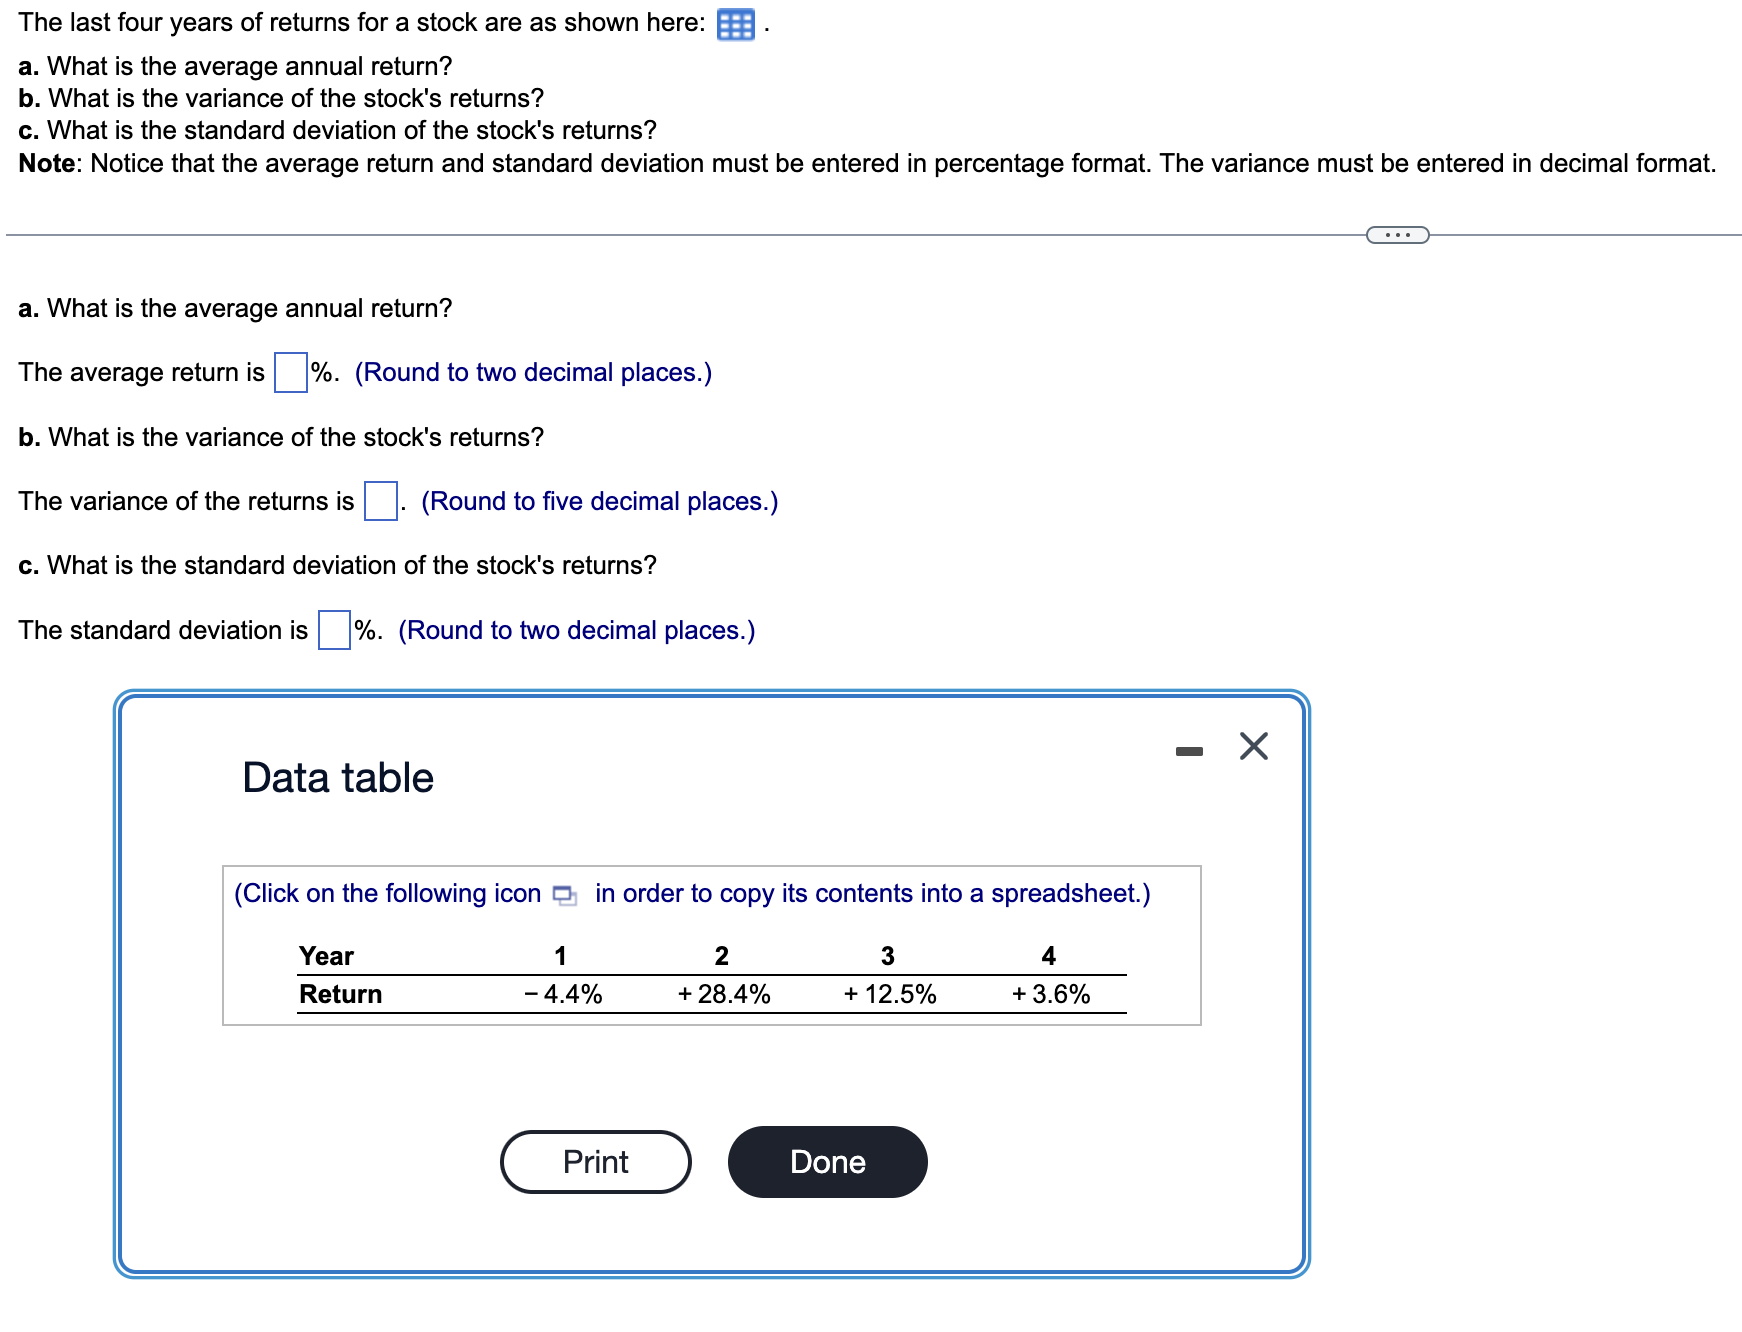
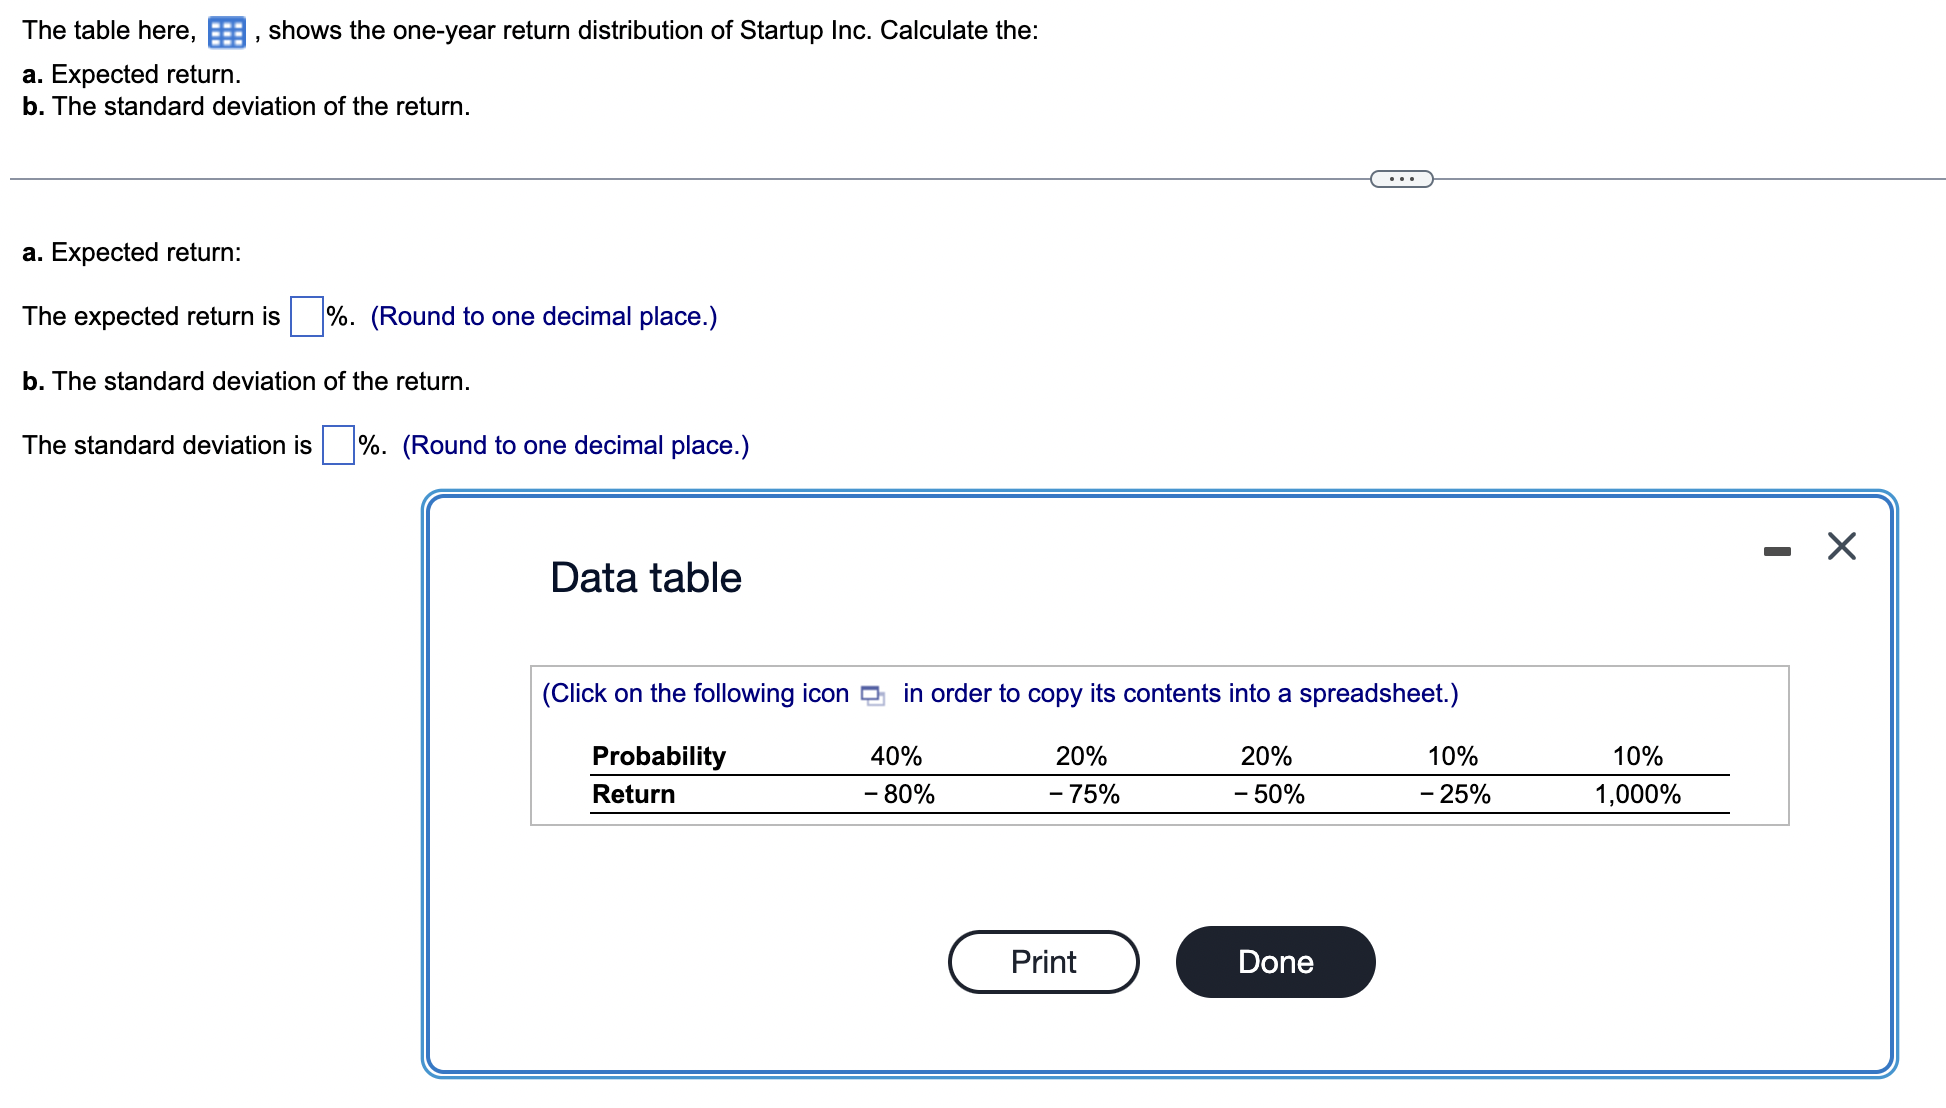
The table here, , shows the one-year return distribution of Startup Inc. Calculate the: a. Expected return. b. The standard deviation of the return. a. Expected return: The expected return is %. (Round to one decimal place.) b. The standard deviation of the return. The standard deviation is \%. (Round to one decimal place.) Data table (Click on the following icon in order to copy its contents into a spreadsheet.) The last four years of returns for a stock are as shown here: a. What is the average annual return? b. What is the variance of the stock's returns? c. What is the standard deviation of the stock's returns? Note: Notice that the average return and standard deviation must be entered in percentage format. The variance must be entered in decimal format. a. What is the average annual return? The average return is %. (Round to two decimal places.) b. What is the variance of the stock's returns? The variance of the returns is . (Round to five decimal places.) c. What is the standard deviation of the stock's returns? The standard deviation is \%. (Round to two decimal places.) Data table (Click on the following icon in order to copy its contents into a spreadsheet.)
Step by Step Solution
There are 3 Steps involved in it

Get step-by-step solutions from verified subject matter experts